. 2008 May;47(5):1495-503.
doi: 10.1002/hep.22183.

The lysosomal-mitochondrial axis in free fatty acid-induced hepatic lipotoxicity

Affiliations

The lysosomal-mitochondrial axis in free fatty acid-induced hepatic lipotoxicity

ZhengZheng Li et al. Hepatology. 2008 May.

Abstract

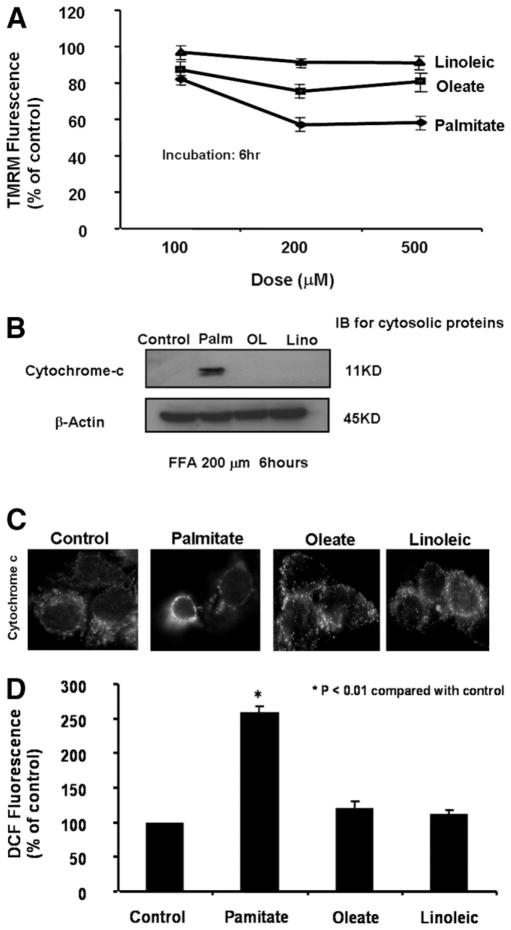
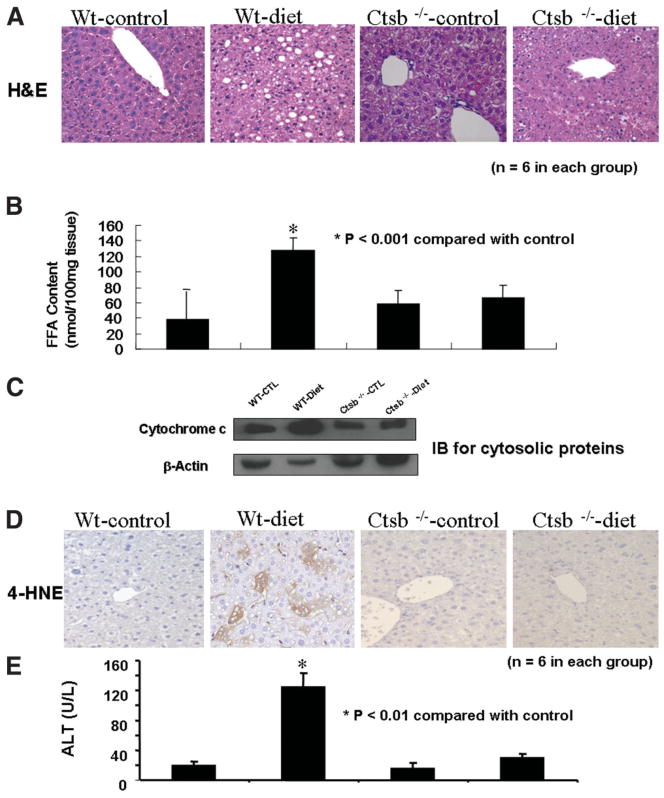
Impaired mitochondrial function is largely thought to be a core abnormality responsible for disease progression in nonalcoholic fatty liver disease (NAFLD). However, the molecular mechanisms resulting in mitochondrial dysfunction in NAFLD remain poorly understood. This study examined the effects of excessive accumulation of free fatty acids (FFAs) in liver cells on mitochondrial function and the role of the lysosomal-mitochondrial axis on lipotoxicity. Primary mouse hepatocytes, HepG2 and McNtcp.24 cells, were treated with varied concentrations of FFAs with different degrees of saturation for up to 24 hours. Mitochondrial function was monitored by real-time imaging, cytochrome c redistribution, and reactive oxygen species (ROS) production. The temporal relationship of lysosomal and mitochondrial permeabilization was established. Activity of the lysosomal protease cathepsin B was suppressed by genetic and pharmacological approaches. Cathepsin B-knockout mice and wild-type animals were place on a high-carbohydrate diet for 16 weeks, and mitochondrial function and liver damage were assessed. Exposure of liver cells to saturated FFAs resulted in mitochondrial depolarization, cytochrome c release, and increased ROS production. Lysosomal permeabilization and cathepsin B redistribution into the cytoplasm occurred several hours prior to mitochondrial dysfunction. Either pharmacological or genetic inhibition of cathepsin B preserved mitochondrial function. Finally, cathepsin B inactivation protected mitochondria, decreased oxidative stress, and attenuated hepatic injury in vivo.

Conclusion: These data strongly suggest excessive accumulation of saturated FFAs in liver cells directly induce mitochondrial dysfunction and oxidative stress. Our data further suggest this process is dependent on lysosomal disruption and activation of cathepsin B.


Figures

Fig. 1
Fig. 1
Free fatty acids (FFAs) induced dose- and saturation-dependent mitochondrial dysfunction. Isolated hepatocytes from C57BL/6 mice were incubated in the presence or absence of various concentrations of FFAs with different degrees of saturation for up 24 hours. (A) Mitochondrial permeabilization was determined by staining with tetramethylrhodamine methyl ester (TMRM, 549/573 nm), a mitochondrion-selective dye that is released after mitochondrial depolarization in unfixed live cells and visualized under fluorescent microscopy. (B) Cells were treated with 0.2 mM of various FFAs for 6 hours. Cytosolic fractions were prepared by selective permeabilization with digitonin. Cytosolic proteins were resolved by SDS-PAGE gels, transferred to nitrocellulose, and probed for cytochrome c. β-Actin served as a control for protein loading. (C) Cytochrome c subcellular localization was further investigated by immunofluorescence. Cells were fixed and incubated with anti–cytochrome c antibody (1:100 dilution) for 1 hour at room temperature. (D) Finally, the effect of FFA overaccumulation on hepatocyte ROS production was monitored using the nonfluorescent cell-permeant compound 2′,7′-dichlorofluorescin diacetate (DCFH-DA). This technique is based on the principle that on oxidation by ROS, the deesterified form of this compound becomes the fluorescent compound dichlorofluorescin (DCF). FFA-treated cells were loaded with 10 μM of DCFH-DA (Molecular Probes) in KRH buffer for 30 min at 37°C. The fluorescent compound DCF was monitored at the single-cell level using an inverted fluorescent microscope.
Fig. 2
Fig. 2
FFAs induced mitochondrial depolarization and cytochrome c release downstream of lysosomal permeabilization and cathepsin B activation. (A) Cells were incubated with or without 0.2 mM FFA for up to 6 hours. A time course of lysosomal and mitochondrial permeabilization induced by FFAs was determined by staining with LysoTracker Red (LTR) and tetramethylrhodamine methyl ester (TMRM) in unfixed live cells and visualized under fluorescent microscopy. Values represent average fluorescence expressed as percentage of fluorescence at 0 hours. Results are expressed as mean ± SE from 15 to 30 cells per treatment group and 3 independent experiments (*P < 0.05 compared with fluorescence at baseline. (B) Cells were incubated with or without 0.2 mM FFA for up to 6 hours. A time course of cathepsin B and cytochrome c redistribution into the cytoplasm was investigated by immunoblot analysis of cytosolic fractions as detailed in the Materials and Methods section.
Fig. 3
Fig. 3
FFA-induced cytochrome c release was reduced by cathepsin B inhibition. HepG2 cells were treated with 0.2 mM FFA in the presence or absence of a cathepsin B–selective inhibitor (CA074; 20 μM) for 6 hours. Staurosporine (STS; 3 μM) was used as a positive control. (A) Cytosolic fractions were prepared by selective permeabilization with digitonin. Cytosolic proteins were resolved by SDS-PAGE gels, transferred to nitrocellulose, and probed for cytochrome c. β-Actin served as a control for protein loading. (B) Cytochrome c subcellular localization was further investigated by immunofluorescence. Cells were fixed and incubated with anti– cytochrome c antibody (1:100 dilution) for 1 hour at room temperature.
Fig. 4
Fig. 4
FFAs induced loss of mitochondrial membrane potential in a cathepsin B– dependent manner. Cells were incubated with or without FFAs in the presence or absence of a cathepsin B–selective inhibitor (CA074) for 6 hours. Staurosporine (STS; 3 μM) was used as a positive control. (A) Mitochondrial transmembrane potential was then measured by real-time imaging of TMRM fluorescence as already described. (B) Values represent average fluorescence expressed as percentage of fluorescence under the control conditions. Results are expressed as mean ± SE from 15 to 30 cells per treatment group and 3 independent experiments.
Fig. 5
Fig. 5
Cathepsin B siRNA effectively inhibited cathepsin B in HepG2 cells. Cathepsin B expression in HepG2 cells was silenced by siRNA as detailed in the Materials and Methods section. After transfection of HepG2 cells with cathepsin B siRNA, (A) an immunoblot for Bax and β-actin was performed, and (B) cathepsin B activity was measured using a cathepsin B activity assay as detailed in the Materials and Methods section (*P < 0.01 compared with control; Ctsb, cathepsin B; Scr., scramble; siRNA, small interfering RNA.
Fig. 6
Fig. 6
Genetic inhibition of cathepsin B protected mitochondrial function. After 48 hours of transfection with either the cathepsin B or scramble siRNA, cells were treated with palmitate for 6 hours. (A) Cytosolic fractions were prepared by selective permeabilization with digitonin. Cytosolic proteins were resolved by SDS-PAGE gels, transferred to nitrocellulose, and probed for cytochrome c. β-Actin served as a control for protein loading. (B) Cytochrome c subcellular localization was investigated by immunofluorescence. Cells were fixed and incubated with anti– cytochrome c antibody (1:100 dilution) for 1 hour at room temperature.
Fig. 7
Fig. 7
Ctsb−/− animals were protected against diet-induced mitochondrial dysfunction and liver injury. Cathepsin B– knockout (ctsb−/−) mice and their wild-type controls (ctsb+/+) were placed on a high-carbohydrate diet for 16 weeks. (A) Representative microphotograph of H&E staining. (B) Hepatic FFA content in the 4 groups of mice. (C) Immunoblots for cytosolic cytochrome c (β-actin served as a control for protein loading). (D) Immunohistochemistry for 4-hydroxynonenal (4-HNE), a representative lipid peroxide product of oxidative stress in liver sections from ctsb−/− and ctsb+/+ animals on a control diet or a high-carbohydrate diet. (E) Serum ALT levels in the 4 groups of mice.

References

    1. Wieckowska A, Feldstein AE. Nonalcoholic fatty liver disease in the pediatric population: a review. Curr Opin Pediatr. 2005;17:636–641. - PubMed
    1. Angulo P. Nonalcoholic fatty liver disease. N Engl J Med. 2002;346:1221–1231. - PubMed
    1. Brunt EM, Neuschwander-Tetri BA, Oliver D, Wehmeier KR, Bacon BR. Nonalcoholic steatohepatitis: histologic features and clinical correlations with 30 blinded biopsy specimens. Hum Pathol. 2004;35:1070–1082. - PubMed
    1. Adams LA, Lymp JF, St Sauver J, Sanderson SO, Lindor KD, Feldstein A, et al. The natural history of nonalcoholic fatty liver disease: a population-based cohort study. Gastroenterology. 2005;129:113–121. - PubMed
    1. Matteoni CA, Younossi ZM, Gramlich T, Boparai N, Liu YC, McCullough AJ. Nonalcoholic fatty liver disease: a spectrum of clinical and pathological severity. Gastroenterology. 1999;116:1413–1419. - PubMed

Publication types