. 2008 Apr 1;40(2):615-630.
doi: 10.1016/j.neuroimage.2007.11.047. Epub 2007 Dec 8.

Automated ventricular mapping with multi-atlas fluid image alignment reveals genetic effects in Alzheimer's disease

Affiliations

Automated ventricular mapping with multi-atlas fluid image alignment reveals genetic effects in Alzheimer's disease

Yi-Yu Chou et al. Neuroimage. .

Abstract

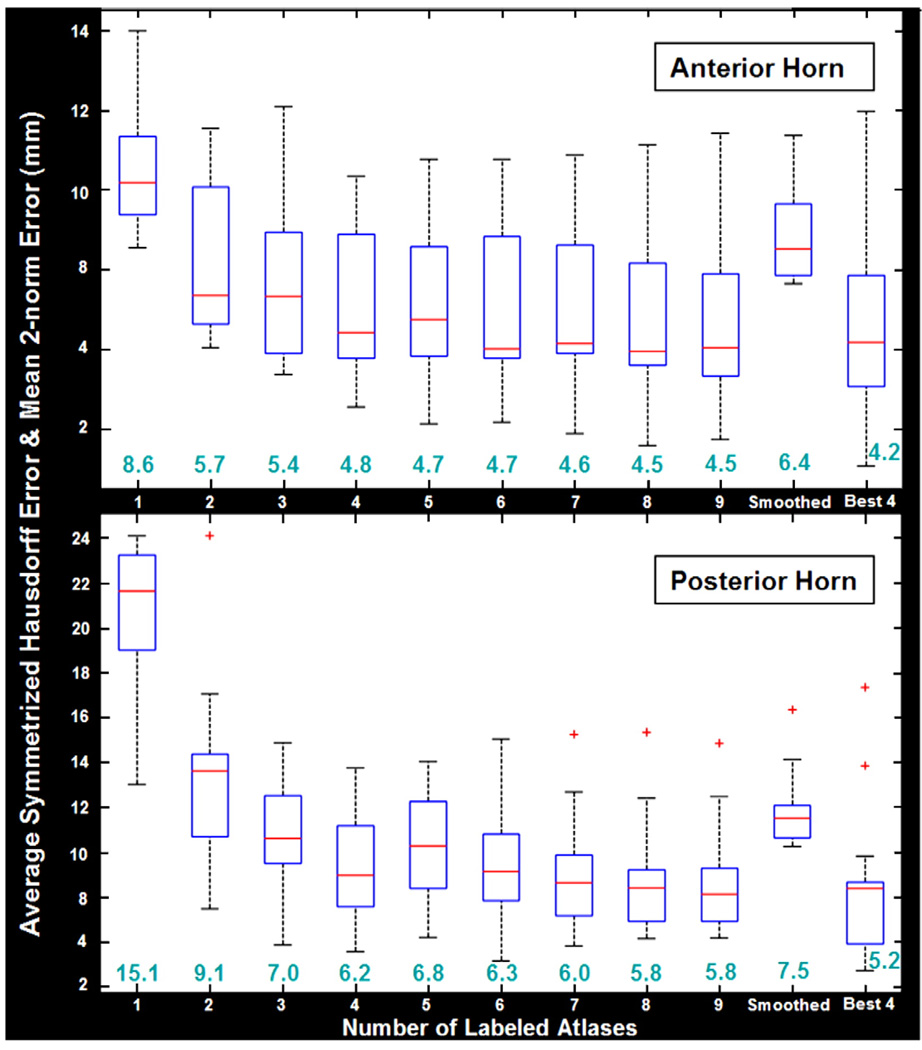
We developed and validated a new method to create automated 3D parametric surface models of the lateral ventricles in brain MRI scans, providing an efficient approach to monitor degenerative disease in clinical studies and drug trials. First, we used a set of parameterized surfaces to represent the ventricles in four subjects' manually labeled brain MRI scans (atlases). We fluidly registered each atlas and mesh model to MRIs from 17 Alzheimer's disease (AD) patients and 13 age- and gender-matched healthy elderly control subjects, and 18 asymptomatic ApoE4-carriers and 18 age- and gender-matched non-carriers. We examined genotyped healthy subjects with the goal of detecting subtle effects of a gene that confers heightened risk for Alzheimer's disease. We averaged the meshes extracted for each 3D MR data set, and combined the automated segmentations with a radial mapping approach to localize ventricular shape differences in patients. Validation experiments comparing automated and expert manual segmentations showed that (1) the Hausdorff labeling error rapidly decreased, and (2) the power to detect disease- and gene-related alterations improved, as the number of atlases, N, was increased from 1 to 9. In surface-based statistical maps, we detected more widespread and intense anatomical deficits as we increased the number of atlases. We formulated a statistical stopping criterion to determine the optimal number of atlases to use. Healthy ApoE4-carriers and those with AD showed local ventricular abnormalities. This high-throughput method for morphometric studies further motivates the combination of genetic and neuroimaging strategies in predicting AD progression and treatment response.


Figures

Fig. 1
Fig. 1
Mapping multiple surface-based atlases into new subjects’ scans via fluid registration. MRI scans of M different subjects (typically including both patients and controls, or a small sample representative of the individuals in the study) are first linearly registered to the ICBM standard space. N image volumes (subsequently called atlases) are randomly selected from the sample and the lateral ventricles are manually traced and converted into surface mesh models. M × N new ventricular models are then produced by fluid registration of each image volume to a different atlas. The N surface meshes per subject are integrated by simple mesh averaging for each individual subject.
Fig. 2
Fig. 2
A flow chart shows how distance maps are used to model ventricular shape. The three horns (anterior, posterior, and inferior) of the lateral ventricles are traced manually in consecutive coronal sections (1), and converted into 3D parametric surface meshes composed of spatially uniform triangular tiles (2). Distance maps are computed (3) that specify the 3D distance of each ventricular surface point to a medial reference curve [red curve; (2)]. The radial distance maps are averaged across subjects and displayed on the average surface across subjects, where the average surface is computed using a mesh averaging technique (4).
Fig. 3
Fig. 3
Plots of the average symmetrized Hausdorff error and mean 2-norm error for label propagation in the anterior and posterior horns of the ventricles. These plots are based on segmentations of 18 image volumes (8 AD patients, 10 controls), comparing automated segmentations with independent, manually derived left ventricular surface models. The horizontal axis indicates the results of using different numbers of labeled atlases (from 1 to 9) and the results obtained from surfaces generated from a single atlas after applying a 5 × 5 spatial smoothing filter. In the last column, the results are shown for the case where the “best 4” of the labeled atlases are used. The box plots are formed by drawing a line at the median and a box between the lower and upper quartiles. Any data observation that lies more than 1.5 times the interquartile range (IQR) lower than the first quartile or 1.5 times the IQR higher than the third quartile is considered an outlier, and whiskers indicate the most extreme values, on either side of the median, that are not outliers. Thus the box plot identifies the middle 50% of the data, the median, and the extreme points. As shown in the second to last column, applying some spatial smoothing to the surface generated from a single atlas does provide some benefit, but not as much as can be gained by generating multiple atlas surfaces. Segmentation results using a subset of the best 4 atlases are as good as using all 9, and marginally better than randomly picking 4. The mean 2-norm error is shown in green font, for each segmentation approach, and follows a similar pattern to the Hausdorff error.
Fig. 4
Fig. 4
Maps of the lateral surface of the left and right ventricular expansion using multiple atlases, (a) A measure of the radial distance is averaged across patients and, separately, across controls, and plotted on group average ventricular shapes using 4 atlases, (b) plots the ratio of the mean radial distance between patients and controls, revealing regions with 20% expansion radially (blue colors) using 4 atlases, (c) shows the significance of these differences at each surface point with different numbers of atlases (from 1 to 4) based on uncorrected P values.
Fig. 5
Fig. 5
The cumulative P value distribution is shown for the comparison of AD versus control groups, and the effect of varying N, the number of atlases, from 1 to 4, and the best subset of 4 atlases chosen from a set of 9. Also reported are the pFDR, FDR values and the percentage of significance (i.e., the proportion of surface points in the averaged maps with significance values less than 0.05). The pink dashed line represents the expected CDF under the null hypothesis. As can be seen, the statistical power is greater when more atlases are used. Notably, the effect sizes obtainable using the best 4 atlases are comparable to those obtained using 4 randomly selected atlases, but both of these situations give higher effect sizes than using fewer atlases. The proportion of the surface showing significant effects, at the voxel level, rises from a third to well over two-thirds when a greater number of atlases are used for segmentation. Interestingly, it was only marginally better to use the best 4 atlases (versus randomly picking 4), at least compared with the substantial improvement in effect size and Hausdorff error obtained by increasing the number of atlases from 1 to 4.
Fig. 6
Fig. 6
The cumulative P value distribution of AD versus control based on segmentations obtained from various subsets of the set of 4 atlases used in Fig. 5. Top: 4 possible sets of “N = 1” CDF lines. This represents the effect sizes obtained when different single atlases are used as the basis for segmentation. Bottom: 6 possible sets of “N = 2” CDF lines. Note that in the case where a single atlas is chosen, the particular individual used affects the CDF and resulting P value, to some degree (top panel). This is undesirable in an empirical study, as the effects ought to be stable with respect to the arbitrary choices in the segmentation method. When 2 atlases are used, the resulting effect sizes and CDF plots are more stable with respect to the choice of atlases, which is to be expected given that some of the random errors associated with registration are canceled out regardless of which 2 atlases are used. Multi-atlas segmentation therefore not only increases the power to detect group differences, but the results are likely to be more reproducible.
Fig. 7
Fig. 7
Two-tailed t-tests were performed to determine the optimal number of atlases N for (a) anterior and (b) posterior horns. For the current study, using more than 3 atlases did not yield a detectable increase in power. Values shown above the points represent the associated P values for the t-tests of the error reduction caused by adding another atlas.
Fig. 8
Fig. 8
Plots of labeling error for brains of subjects of different ages. To determine whether older subjects are labeled more accurately than younger ones, these plots show the average symmetrized Hausdorff error (in millimeters) for labeling each of a range of subjects of different ages. Data are presented for labelings using 1 to 9 different atlases. The labeling error for every subject falls when multiple atlases are used, and there is no obvious age effect on labeling accuracy. Conversely, these error metrics also measure the expected labeling error if each of these brains labeled here were used instead as an atlas template to label other brains. There is no obvious benefit to selecting subjects of a certain age as templates, but subsets of atlases could certainly be chosen, based on this type of data, to minimize the expected labeling error. The blue ticks on horizontal axis indicate the data points (8 AD patients, 10 controls) that actually occur in these line plots.

References

    1. Ashbumer J, Friston KJ. Spatial normalization. In: Toga AW, editor. Brain Warping, ch. 2. San Diego, USA: Academic Press; 1999. pp. 27–44.
    1. American Psychiatric Association. Diagnostic and Statistical Manual of Mental Disorders. Ed 4. Washington, DC: American Psychiatric Association; 2000. (DSM-IV)
    1. Babalola KO, Cootes TF, Twining CJ, Petrovic V, Schestowitz R, Taylor CJ. Building 3D Statistical Shape Models using Groupwise Registration. Proceedings of the 12th annual meeting of the Organization for Human Brain Mapping; Florence, Italy. 2006.
    1. Benjamini Y, Hochberg Y. Controlling the false discovery rate: a practical and powerful approach to multiple testing. J. R. Stat. Soc, Ser. B Method. 1995;57:289–300.
    1. Beyer K, Lao JI, Fernandez-Novoa L, Alvarez XA, Sellers MA, Cacabelos R. APOE epsilon 4 allele frequency in Alzheimer’s disease and vascular dementia in the Spanish population. Ann. N. Y. Acad. Sci. 1997;826:452–455. (1997 Sep 26) - PubMed

Publication types

Substances