. 2008 May 15;94(10):3893-911.
doi: 10.1529/biophysj.107.116731. Epub 2008 Jan 25.

Thermodynamic and kinetic properties of amino-terminal and S4-S5 loop HERG channel mutants under steady-state conditions

Affiliations

Thermodynamic and kinetic properties of amino-terminal and S4-S5 loop HERG channel mutants under steady-state conditions

Carlos Alonso-Ron et al. Biophys J. .

Abstract

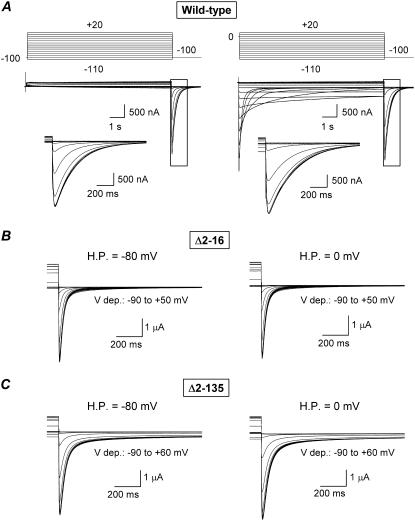
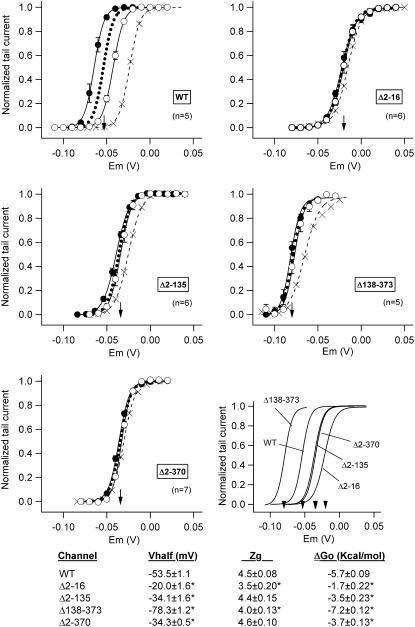
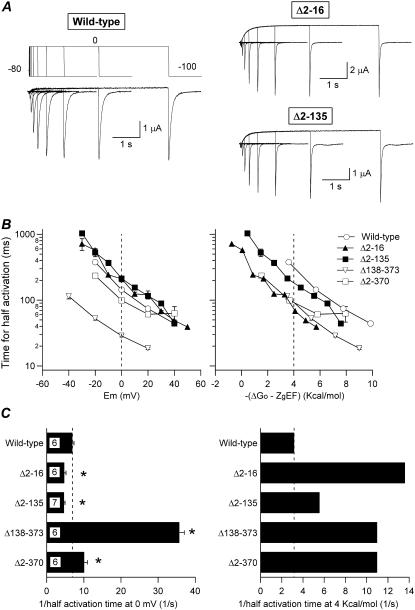
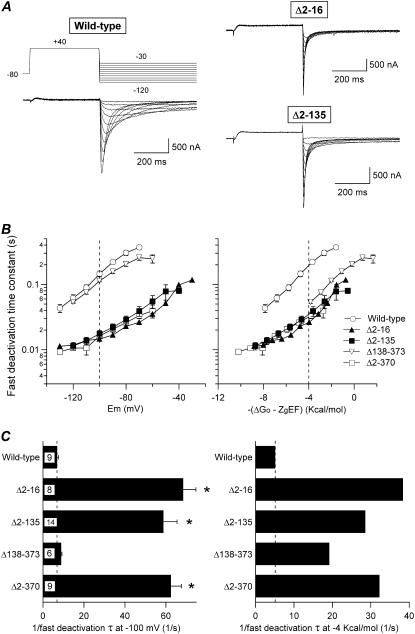
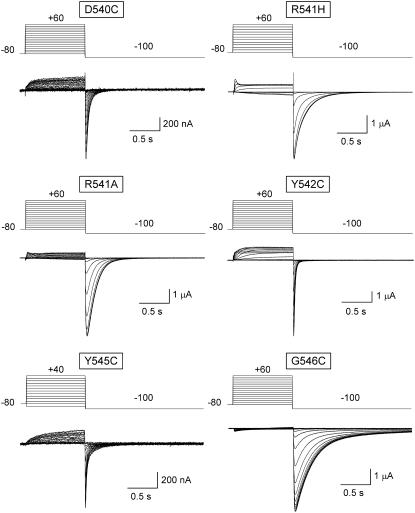
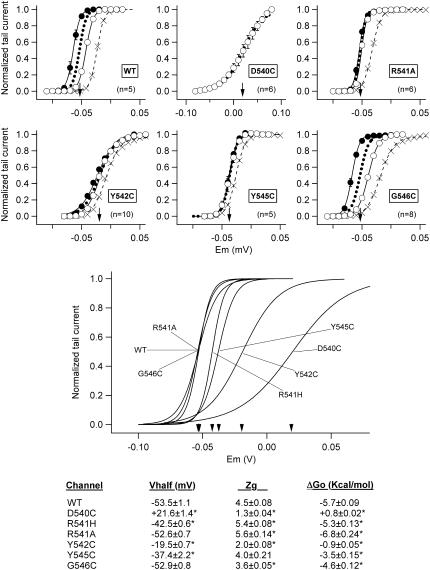
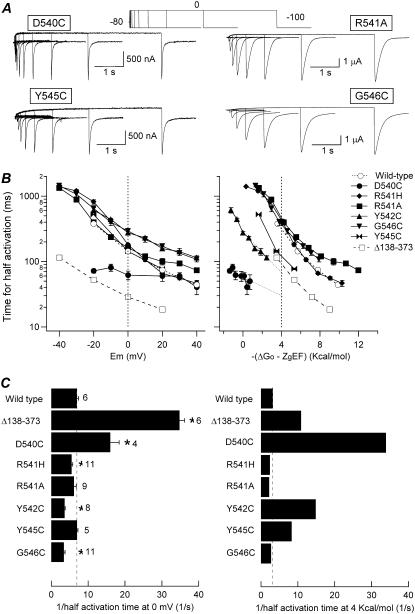
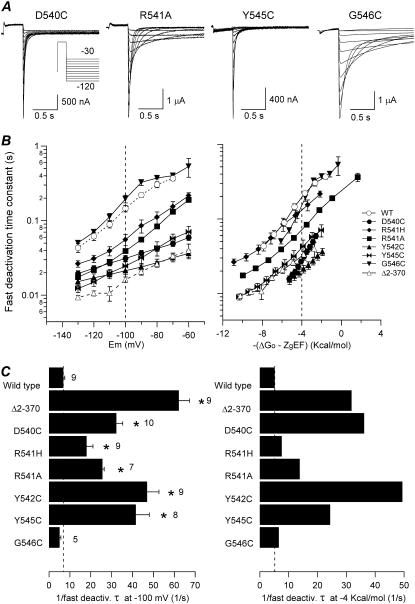
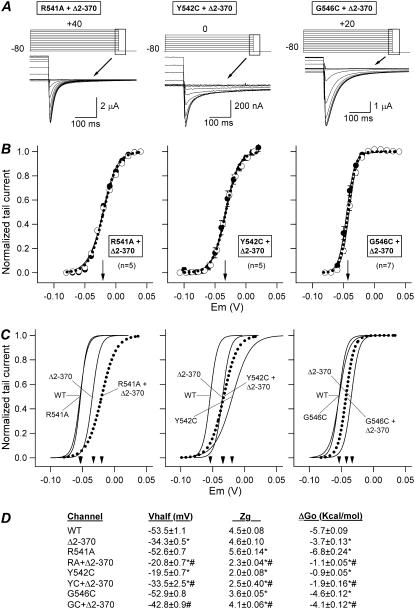
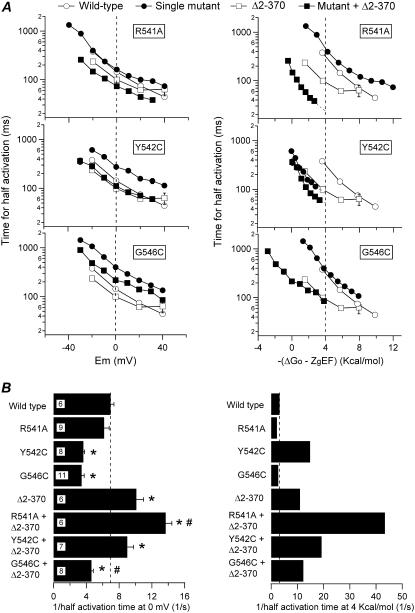
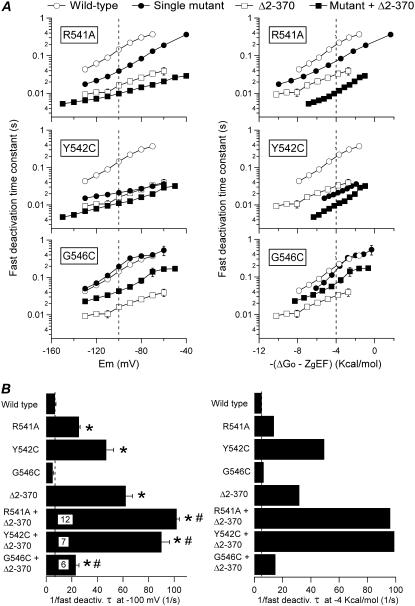
Gating kinetics and underlying thermodynamic properties of human ether-a-go-go-related gene (HERG) K(+) channels expressed in Xenopus oocytes were studied using protocols able to yield true steady-state kinetic parameters. Channel mutants lacking the initial 16 residues of the amino terminus before the conserved eag/PAS region showed significant positive shifts in activation voltage dependence associated with a reduction of z(g) values and a less negative DeltaG(o), indicating a deletion-induced displacement of the equilibrium toward the closed state. Conversely, a negative shift and an increased DeltaG(o), indicative of closed-state destabilization, were observed in channels lacking the amino-terminal proximal domain. Furthermore, accelerated activation and deactivation kinetics were observed in these constructs when differences in driving force were considered, suggesting that the presence of distal and proximal amino-terminal segments contributes in wild-type channels to specific chemical interactions that raise the energy barrier for activation. Steady-state characteristics of some single point mutants in the intracellular loop linking S4 and S5 helices revealed a striking parallelism between the effects of these mutations and those of the amino-terminal modifications. Our data indicate that in addition to the recognized influence of the initial amino-terminus region on HERG deactivation, this cytoplasmic region also affects activation behavior. The data also suggest that not only a slow movement of the voltage sensor itself but also delaying its functional coupling to the activation gate by some cytoplasmic structures possibly acting on the S4-S5 loop may contribute to the atypically slow gating of HERG.


Figures

FIGURE 1
FIGURE 1
Effect of deleting the initial region of the amino terminus on HERG currents recorded with protocols designed to yield steady-state activation voltage dependence. (A) Membrane currents obtained from an oocyte expressing wild-type HERG channels after 10-s depolarizations to different voltages as indicated at the top. Holding potentials of −100 mV to keep the channels fully closed (left) and 0 mV to hold them fully open (right) were used. Currents at the end of the depolarizing steps and the tail currents at −100 mV corresponding to the boxed area are shown expanded in the insets. (B and C) Membrane currents in oocytes expressing HERG constructs lacking the initial 16 amino acids (Δ2-16) or the initial region of the amino terminus including the eag/PAS domain (Δ2-135). Tail currents at −80 (B) or −100 mV (C) were obtained after 10-s prepulses between −90 and +50/+60 mV in 10-mV increments. Only the end of the depolarizing steps and the tail currents are shown for simplicity. Holding potentials (H.P.) of −80 (left traces) and 0 mV (right traces) were used as indicated on the graphs.
FIGURE 2
FIGURE 2
Effect of amino-terminal deletions on HERG activation voltage dependence under steady-state conditions. Fractional activation curves for wild-type (WT) and the indicated channel variants were obtained from tail current data obtained as detailed in Fig. 1. Open and filled symbols correspond to data obtained in response to 10-s prepulses from hyperpolarized (−80 to −110 mV) and depolarized (0 to +40 mV) holding voltages, respectively. The continuous lines correspond to Boltzmann curves that best fitted the data. The dotted lines represent the deduced position of the activation curves under steady-state conditions, obtained by horizontally averaging the values of the two lines coming from both holding voltages to prevent alterations in the sigmoidal shape of the traces. The V½ values for the steady-state curves are indicated by arrows in the graphs. Activation curves obtained with prepulses of 1-s duration (crosses) from hyperpolarized holding potentials are also shown for comparison. Steady-state curves for the different constructs are shown superimposed (lower right panel). Kinetic and thermodynamic parameters obtained under steady-state conditions for the different channel variants are summarized at the bottom. *p < 0.05 versus wild-type.
FIGURE 3
FIGURE 3
Effect of amino-terminal deletions on HERG activation rates. (A) Comparison of channel activation rates at 0 mV in oocytes expressing wild-type HERG and Δ2-16 or Δ2-135 constructs. The time course of voltage-dependent activation was studied by varying the duration of a depolarizing pulse to 0 mV following the voltage protocol shown on top of the wild-type current traces. Current traces corresponding to depolarization steps of 0, 20, 40, 80, 160, 320, 640, 1280, 2560, and 5120 ms are shown superimposed. (B) Dependence of activation rates on depolarization membrane potential (left) or total potential driving force (right) for channels carrying different deletions in the amino terminus. The magnitude of the peak tail current on repolarization was determined from recordings as shown in panel A after varying the duration of depolarization prepulses to different potentials. The time necessary to attain half-maximum tail current magnitude is plotted versus either depolarization potential (left) or total energy driving activation (i.e., −(ΔGozgEF), right). ΔGo and zg values were derived as detailed in Methods from steady-state activation voltage-dependence curves of the different channels. Data from Δ138-373 and Δ2-370 deleted channels are also shown for comparison. (C) Summary of activation rates at 0 mV (left) and 4 kcal/mol of electrochemical driving force (right). The speed of activation of the different constructs is compared as measured by the inverse value of the half activation time. The t½ values at 0 mV or those graphically determined at 4 kcal/mol from the crossing of the activation graphs and the 4 kcal/mol line in B (right panel) were used. *p < 0.05 versus wild-type.
FIGURE 4
FIGURE 4
Effect of amino-terminal deletions on HERG deactivation rates. (A) Comparison of channel deactivation in wild-type channels and Δ2-16 or Δ2-135 constructs carrying deletions in the eag/PAS region. Families of currents were obtained during steps to potentials ranging from −120 to −30 mV after depolarization pulses to open (and inactivate) the channels, as indicated at the top of the wild-type current traces. Only the first part of the 4-s repolarization steps used to follow the complete decay of the tail currents is shown for clarity. (B) Dependence of deactivation rates on repolarization membrane potential (left) or total potential driving force (right) for channels carrying different deletions in the amino terminus. Deactivation time constants were quantified by fitting a double exponential to the decaying portion of the tails as described in Methods. Only the magnitude of the deactivation time constant corresponding to the fast decaying current major component at negative voltages is shown. Data from Δ138-373 and Δ2-370 deleted channels are also shown for comparison. (C) Summary of deactivation rates at −100 mV (left) and −4 kcal/mol of electrochemical driving force (right). The speed of deactivation of the different constructs are compared as reflected by the inverse value of the deactivation time constant. Values obtained at −100 mV or those graphically determined at −4 kcal/mol from the deactivation graphs and the −4 kcal/mol line crossing in B (right panel) were used. *p < 0.05 versus wild-type.
FIGURE 5
FIGURE 5
Effect of S4-S5 loop single point mutations on HERG currents obtained at different depolarization voltages. Families of currents were obtained with the protocols indicated on top of the traces, using 1-s depolarizations to test potentials between −80 and +60 mV in 10-mV steps from a holding potential of −80 mV. Note the differences in the tail-current kinetics of the different mutants on repolarization to −100 mV.
FIGURE 6
FIGURE 6
Effect of S4-S5 loop mutations on HERG activation voltage dependence under steady-state conditions. Fractional activation curves for wild-type (WT) and the indicated mutants were obtained from tail-current data obtained as detailed in Fig. 2. Open and filled symbols correspond to data obtained after 10-s depolarization prepulses from hyperpolarized and depolarized holding voltages at which channels are maintained closed and open, respectively. Fully superimposable graphs after short 1-s depolarizations from both holding potentials are illustrated in the case of the very fast activating and deactivating D540C channels. The continuous lines correspond to Boltzmann curves that best fit the data, and the dotted lines represent the deduced position of the activation curves under steady-state conditions obtained as a mean of those corresponding to both holding voltages. The V½ values for the steady-state curves are indicated by arrows in the graphs. Activation curves obtained with prepulses of 1-s duration (crosses) from hyperpolarized holding potentials are also shown for comparison. Steady-state curves for the different constructs are shown superimposed (lower panel). Kinetic and thermodynamic parameters obtained under steady-state conditions for the different channels are summarized at the bottom. *p < 0.05 versus wild-type.
FIGURE 7
FIGURE 7
Effect of S4-S5 loop mutations on HERG activation rates. (A) Comparison of channel activation rates at 0 mV in oocytes expressing different S4-S5 loop single-point mutants. Representative families of currents recorded using an envelope-of-tails protocol as detailed in Fig. 3 are shown. (B) Dependence of activation rates on depolarization membrane potential (left) or total potential driving force (right) for the different mutants. The time necessary to attain half-maximum tail-current magnitude is plotted against depolarization potential (left) or total energy driving activation (i.e., −(ΔGozgEF); right). Data from either wild-type channels or those deleted in the proximal domain (Δ138-373), with strong accelerations in activation kinetics (33,34), are also shown for comparison. (C) Summary of activation rates at 0 mV (left) and 4 kcal/mol of electrochemical driving force (right). The speed of activation of the different channel variants is compared according to the inverse value of the half-activation time. The t½ values at 0 mV or those graphically determined at 4 kcal/mol from the crossing of the activation graphs and the 4 kcal/mol line in B (right panel) were used. *p < 0.05 versus wild-type.
FIGURE 8
FIGURE 8
Effect of S4-S5 loop mutations on HERG deactivation rates. (A) Representative currents obtained with the voltage protocol indicated in the inset. (B) Plots of fast deactivation time constants as a function of voltage (left) or total electrochemical driving force (right). (C) Summary of deactivation rates at −100 mV (left) and −4 kcal/mol of electrochemical driving force (right). The speed of deactivation of the different mutants is compared according to the inverse value of the deactivation time constant. Time constant values obtained at −100 mV or those graphically determined at −4 kcal/mol were used. *p < 0.05 versus wild-type.
FIGURE 9
FIGURE 9
Steady-state activation voltage dependence of HERG channels without amino terminus and carrying single-point mutations in the S4-S5 loop. (A) Comparison of membrane currents obtained from oocytes expressing double mutant HERG channels after 10-s depolarizations to different voltages as indicated at the top. Only currents recorded at the end of the depolarizing steps and the tail currents corresponding to the boxed area are shown. Note the more negative repolarization voltage (−100 mV) used with G546C + Δ2-370 channels as compared with that (−80 mV) used with R541A + Δ2-370 and Y542C + Δ2-370 constructs. (B) Activation voltage dependence under steady-state conditions of the double mutant channels. Fractional activation curves were obtained from tail currents, with open and filled symbols corresponding to data recorded in response to 10-s prepulses from hyperpolarized and depolarized holding voltages, respectively. The continuous lines correspond to Boltzmann curves that best fitted the data. The dotted lines represent the deduced position of the activation curves under steady-state conditions obtained as a mean of those corresponding to both holding voltages. Note the good correspondence of all plots regardless of the holding-potential level. The V½ values for the steady-state curves are indicated by arrows in the graphs. (C) Superimposed steady-state activation curves for different constructs. Activation curves for wild-type channels and those corresponding to the single mutants are also shown for comparison. (D) Summary of kinetic and thermodynamic parameters obtained under steady-state conditions for the different channels. *p < 0.05 versus wild-type. #p < 0.05 versus single mutants in the S4-S5 loop or amino-terminus-deleted Δ2-370 channel.
FIGURE 10
FIGURE 10
Effect of combining S4-S5 single-point mutations with the deletion of the amino terminus on HERG activation rates. (A) Plots of the dependence of activation rates on depolarization membrane potential (left) or total potential driving force (right) for the different mutants. (B) Comparisons of the activation speed expressed as the inverse of the half-activation time at 0 mV (left) or 4 kcal/mol of electrochemical driving force (right). Data from wild-type channels and single mutants also illustrated in Figs. 3 and 7 are shown for comparison. *p < 0.05 versus wild-type. #p < 0.05 versus single mutants in the S4-S5 or amino-terminus-deleted Δ2-370 channel.
FIGURE 11
FIGURE 11
Effect of combining S4-S5 single-point mutations with the deletion of the amino terminus on HERG deactivation rates. (A) Plots of fast deactivation time constants as a function of voltage (left) or total electrochemical driving force (right). (B) Summary of deactivation rates at −100 mV (left) and −4 kcal/mol of electrochemical driving force (right). The speed of deactivation of the different mutants is compared according to the inverse value of the deactivation time constant. Data from wild-type channels and single mutants also illustrated in Figs. 4 and 8 are shown for better comparison. *p < 0.05 versus wild-type. #p < 0.05 versus single mutants in the S4-S5 loop or amino-terminus-deleted Δ2-370 channel.

References

    1. Sanguinetti, M. C., C. Jiang, M. E. Curran, and M. T. Keating. 1995. A mechanistic link between an inherited and an acquired cardiac arrhythmia: HERG channel encodes the IKr potassium channel. Cell. 81:299–307. - PubMed
    1. Trudeau, M. C., J. W. Warmke, B. Ganetzky, and G. A. Robertson. 1995. HERG, a human inward rectifier in the voltage-gated potassium channel family. Science. 269:92–95. - PubMed
    1. Barros, F., C. Villalobos, J. García-Sancho, D. del Camino, and P. de la Peña. 1994. The role of the inwardly rectifying K+ current in resting potential and thyrotropin-releasing hormone-induced changes in cell excitability of GH3 rat anterior pituitary cells. Pflugers Arch. 426:221–230. - PubMed
    1. Barros, F., D. del Camino, L. A. Pardo, T. Palomero, T. Giráldez, and P. de la Peña. 1997. Demonstration of an inwardly rectifying K+ current component modulated by thyrotropin-releasing hormone and caffeine in GH3 rat anterior pituitary cells. Pflugers Arch. 435:119–129. - PubMed
    1. Bauer, C. K., R. Schäfer, D. Schiemann, G. Reid, I. Hanganu, and J. R. Schwarz. 1999. A functional role of the erg-like inward-rectifying K+ current in prolactin secretion from rat lactotrophs. Mol. Cell. Endocrinol. 148:37–45. - PubMed

Publication types