

Toward a molecular understanding of the anisotropic response of proteins to external forces: insights from elastic network models
- PMID: 18223005
- PMCID: PMC2292382
- DOI: 10.1529/biophysj.107.120733
Toward a molecular understanding of the anisotropic response of proteins to external forces: insights from elastic network models
Abstract
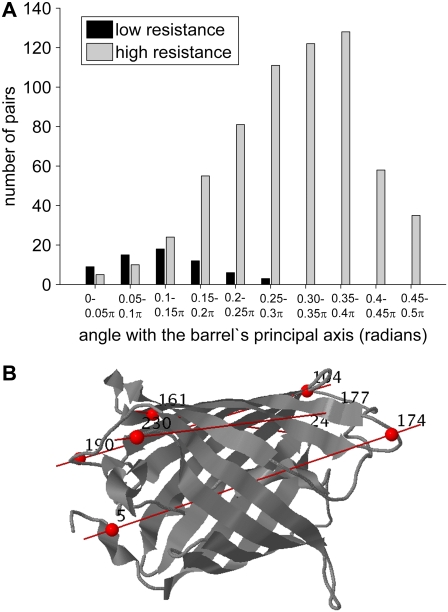
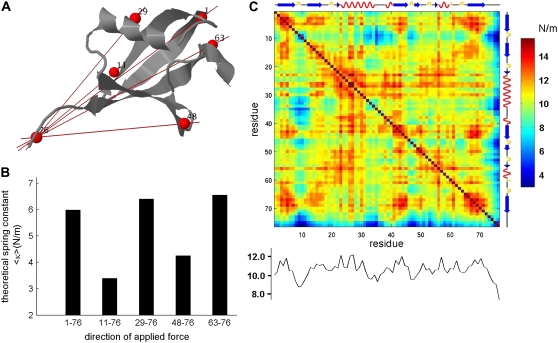
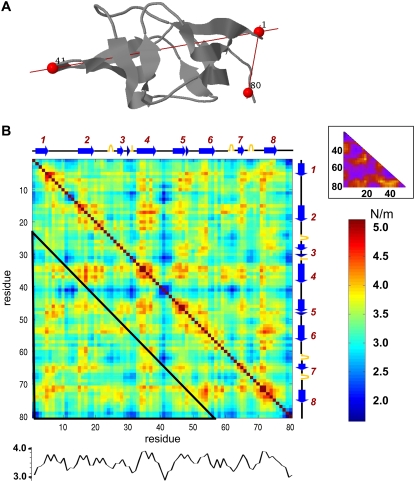
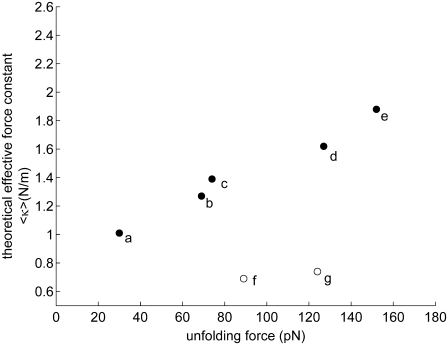
With recent advances in single-molecule manipulation techniques, it is now possible to measure the mechanical resistance of proteins to external pulling forces applied at specific positions. Remarkably, such recent studies demonstrated that the pulling/stretching forces required to initiate unfolding vary considerably depending on the location of the application of the forces, unraveling residue/position-specific response of proteins to uniaxial tension. Here we show that coarse-grained elastic network models based on the topology of interresidue contacts in the native state can satisfactory explain the relative sizes of such stretching forces exerted on different residue pairs. Despite their simplicity, such models presumably capture a fundamental property that dominates the observed behavior: deformations that can be accommodated by the relatively lower frequency modes of motions intrinsically favored by the structure require weaker forces and vice versa. The mechanical response of proteins to external stress is therefore shown to correlate with the anisotropic fluctuation dynamics intrinsically accessible in the folded state. The dependence on the overall fold implies that evolutionarily related proteins sharing common structural features tend to possess similar mechanical properties. However, the theory cannot explain the differences observed in a number of structurally similar but sequentially distant domains, such as the fibronectin domains.
Figures
Similar articles
-
Native flexibility of structurally homologous proteins: insights from anisotropic network model.BMC Biophys. 2017 Jan 31;10:1. doi: 10.1186/s13628-017-0034-9. eCollection 2017. BMC Biophys. 2017. PMID: 28163915 Free PMC article.
-
Temperature-induced unfolding behavior of proteins studied by tensorial elastic network model.Proteins. 2016 Dec;84(12):1767-1775. doi: 10.1002/prot.25157. Epub 2016 Sep 27. Proteins. 2016. PMID: 27578264
-
Elastic bond network model for protein unfolding mechanics.Phys Rev Lett. 2008 Mar 7;100(9):098101. doi: 10.1103/PhysRevLett.100.098101. Epub 2008 Mar 4. Phys Rev Lett. 2008. PMID: 18352751
-
Global dynamics of proteins: bridging between structure and function.Annu Rev Biophys. 2010;39:23-42. doi: 10.1146/annurev.biophys.093008.131258. Annu Rev Biophys. 2010. PMID: 20192781 Free PMC article. Review.
-
Coarse-Grained Protein Dynamics Studies Using Elastic Network Models.Int J Mol Sci. 2018 Dec 5;19(12):3899. doi: 10.3390/ijms19123899. Int J Mol Sci. 2018. PMID: 30563146 Free PMC article. Review.
Cited by
-
GFP's mechanical intermediate states.PLoS One. 2012;7(10):e46962. doi: 10.1371/journal.pone.0046962. Epub 2012 Oct 31. PLoS One. 2012. PMID: 23118864 Free PMC article.
-
Energy Transport along α-Helix Protein Chains: External Drives and Multifractal Analysis.Materials (Basel). 2022 Apr 10;15(8):2779. doi: 10.3390/ma15082779. Materials (Basel). 2022. PMID: 35454472 Free PMC article.
-
Interpretation of Single-Molecule Force Experiments on Proteins Using Normal Mode Analysis.Nanomaterials (Basel). 2021 Oct 22;11(11):2795. doi: 10.3390/nano11112795. Nanomaterials (Basel). 2021. PMID: 34835560 Free PMC article.
-
Exploring the unfolding pathways of protein families using Elastic Network Model.Sci Rep. 2024 Oct 13;14(1):23905. doi: 10.1038/s41598-024-75436-8. Sci Rep. 2024. PMID: 39397155 Free PMC article.
-
Low-Frequency Harmonic Perturbations Drive Protein Conformational Changes.Int J Mol Sci. 2021 Sep 28;22(19):10501. doi: 10.3390/ijms221910501. Int J Mol Sci. 2021. PMID: 34638837 Free PMC article.
References
-
- Kreplak, L., and D. Fudge. 2007. Biomechanical properties of intermediate filaments: from tissues to single filaments and back. Bioessays. 29:26–35. - PubMed
-
- Nollmann, M., M. D. Stone, Z. Bryant, J. Gore, N. J. Crisona, S. C. Hong, S. Mitelheiser, A. Maxwell, C. Bustamante, and N. R. Cozzarelli. 2007. Multiple modes of Escherichia coli DNA gyrase activity revealed by force and torque. Nat. Struct. Mol. Biol. 14:264–271. - PubMed
-
- Rief, M., and H. Grubmuller. 2002. Force spectroscopy of single biomolecules. ChemPhysChem. 3:255–261. - PubMed
-
- Rounsevell, R., J. R. Forman, and J. Clarke. 2004. Atomic force microscopy: mechanical unfolding of proteins. Methods. 34:100–111. - PubMed
-
- Sotomayor, M., and K. Schulten. 2007. Single-molecule experiments in vitro and in silico. Science. 316:1144–1148. - PubMed
MeSH terms
Substances
LinkOut - more resources
Full Text Sources
