. 2008 Apr 1;111(7):3635-43.
doi: 10.1182/blood-2007-11-123141. Epub 2008 Jan 25.

B7-H1 is a ubiquitous antiapoptotic receptor on cancer cells

Affiliations

B7-H1 is a ubiquitous antiapoptotic receptor on cancer cells

Takeshi Azuma et al. Blood. .

Abstract

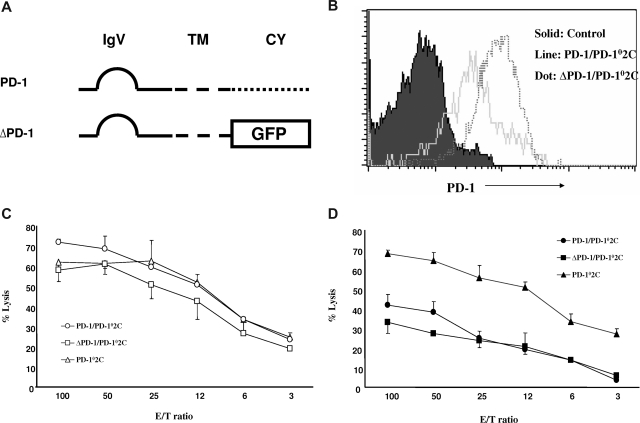
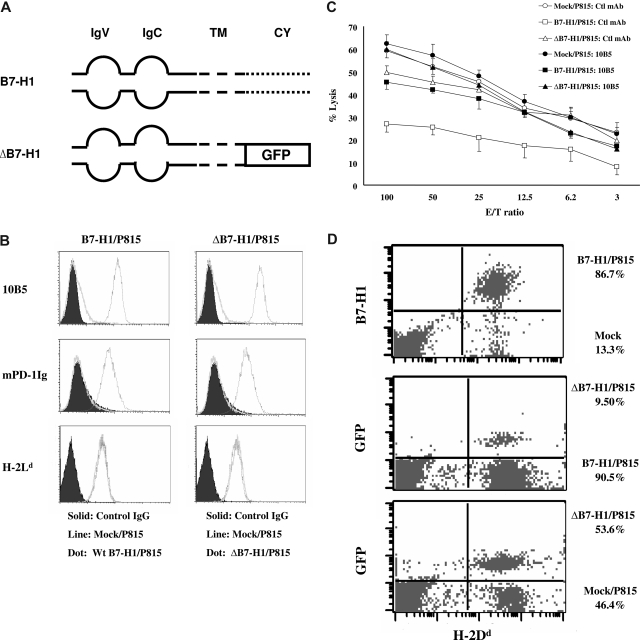
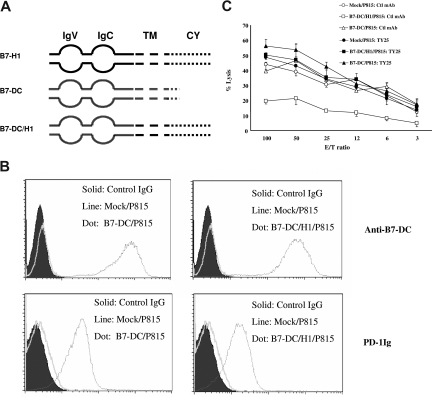
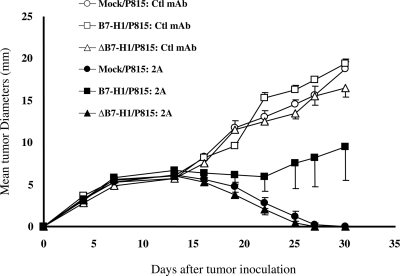
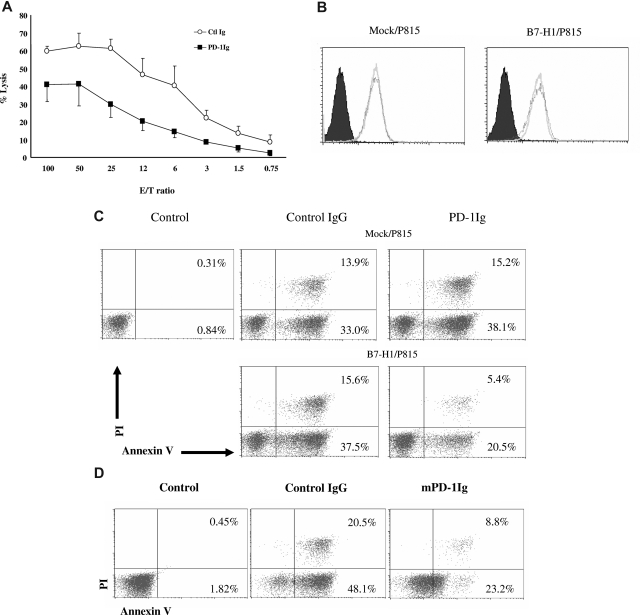
B7-H1 is an immunoglobulin-like immune suppressive molecule broadly detectable on the majority of human and rodent cancers, and its functions have been attributed to delivering an inhibitory signal to its counter-receptor programmed death-1 (PD-1) on T cells. Here we report that B7-H1 on cancer cells receives a signal from PD-1 to rapidly induce resistance against T cell-mediated killing because crippling signaling capacity of B7-H1 but not PD-1 ablates this resistance. Importantly, loss of B7-H1 signaling is accompanied by increased susceptibility to immune-mediated tumoricidal activity. In addition to resistance against T-cell destruction, B7-H1+ cancer cells also become refractory to apoptosis induced by Fas ligation or the protein kinase inhibitor Staurosporine. Our study reveals a new mechanism by which cancer cells use a receptor on immune cells as a ligand to induce resistance to therapy.


Figures

Figure 1
Figure 1
Molecular shield is observed generally. (A) B7-H1+ P815 cells are resistant to allospecific CTL-mediated lysis. Allospecific T cells were incubated at indicated E/T ratios with 51Cr-labeled mock/P815 or B7-H1/P815 cells in the presence of control IgG or anti-mouse B7-H1 mAb (clone 10B5) for 4 hours. CTL activity was determined in a 51Cr release assay. Each point is the mean of triplicates with SD. The data are representative of 3 experiments. (B) B7-H1+ Renca cancer cells are resistant to allospecific CTL-mediated lysis. Renca cells were incubated with IFN-γ (5 ng/mL) for 48 hours to up-regulate B7-H1 expression (data not shown). Activated 2C CTLs were incubated at indicated E/T ratios with 51Cr-labeled Renca cells with control IgG or antimurine B7-H1 antibody (clone 10B5) for 4 hours. CTLs activity was determined in a 51Cr release assay. Each point is the means of triplicates with SD. The data are representative of 3 experiments.
Figure 2
Figure 2
PD-1 signaling to T cells is not required for molecular shield. (A) Schematic of wild-type PD-1 (PD-1) and intracellular domain-truncated PD-1 (ΔPD-1) genes. IgV indicates IgV domain; TM, transmembrane domain; CY, cytoplasmic domain, GFP, gene encoding for GFP. (B) The expression of PD-1 on 2C × PD-1KO T cells upon transduction. PD-1KO (PD-10) 2C T cells were transduced with lentiviruses containing either wild-type PD-1 (PD-1) or truncated PD-1 (ΔPD-1), and each cell line was examined for PD-1 expression by flow cytometry using anti-mouse PD-1 mAb (G4). (C,D) Cytolytic activity of PD-1 transduced PD-102C against P815 tumor cells. Activated PD-1/PD-102C, ΔPD-1/PD-102C, or nontransduced PD-102C CTL was incubated at indicated E/T ratios with 51Cr-labeled mock/P815 (C) or B7-H1/P815 (D) cells in the presence of control IgG or anti-mouse B7-H1 mAb (10B5) for 4 hours. CTL activity was determined in a 51Cr release assay. Each point is the mean of triplicates with SD. Data are representative of 3 experiments.
Figure 3
Figure 3
B7-H1 signaling to tumor cells is required for molecular shield. (A) Schematic of the wild-type B7-H1 (B7-H1) and cytoplasmic domain-truncated B7-H1 (ΔB7-H1) genes. IgV indicates IgV domain; IgC, IgC domain; TM, transmembrane domain; CY, cytoplasmicdomain; GFP, gene encoding GFP. (B) The expression of wild-type B7-H1 (B7-H1; top left) or truncated B7-H1 (ΔB7-H1) on P815 cells (top right) after transfection was determined by flow cytometry using anti-mouse B7-H1 mAb (10B5) or murine PD-1Ig fusion protein. These cell lines were also stained by anti–H-2Ld mAb. (C) Activated 2C CTLs were incubated at indicated E/T ratios with 51Cr-labeled mock/P815, B7-H1/P815, or ΔB7-H1/P815 cells in the presence of control (Ctl) IgG or anti-mouse B7-H1 mAb (10B5) for 4 hours. CTL activity was determined in a 51Cr release assay. Each point is the mean of triplicates with SD. The data are representative of at least 3 experiments. (D) Equal mix of mock/P815 and B7-H1/P815 cells (top), ΔB7-H1/P815, and B7-H1/P815 cells (middle), or mock/P815 and ΔB7-H1/P815 (bottom) were coincubated with 2C CTLs for 4 hours. The E/T ratio is 2.5:1. Cells were harvested and analyzed by flow cytometry. The numbers in the graph indicate the percentage of cells in H-2Dd+ population. The data are representative of at least 3 experiments.
Figure 4
Figure 4
Analysis of chimera of B7-H1 and B7-DC in molecular shield. (A) Schematic of the full-length B7-H1 (B7-H1), full-length B7-DC (B7-DC), and the chimera of B7-H1 and B7-DC (B7-DC/H1) genes. IgV indicates IgV domain; IgC, IgC domain; TM, transmembrane domain; CY, cytoplasmic domain. (B) The expression of B7-DC/B7-H1 chimeric genes on P815 cells. The expression of B7-DC on B7-DC/P815 (top left) or B7-DC/H1/P815 (top right) were determined by flow cytometry analysis using anti–mouse B7-DC mAb (clone TY25). The ability of B7-DC/P815 (bottom left) or B7-DC/H1/P815 (bottom right) to bind PD-1Ig fusion protein was also determined similarly. (C) Extracellular domain swap between B7-H1 and B7-DC does not affect molecular shield. Activated 2C CTLs were incubated at indicated E/T ratios with 51Cr-labeled mock/P815, full-length B7-DC/P815, or B7-DC/H1/P815 cells in the presence of control IgG or anti–mouse B7-DC mAb for 4 hours. CTL activity was determined in a 51Cr release assay. Each point is the mean of triplicates with SD. The data are representative of at least 3 experiments.
Figure 5
Figure 5
Loss of molecular shield is associated with increased efficacy of anti-CD137 mAb therapy. Groups of 10 DBA/2 mice were given subcutaneous injections of 5 × 10⁴ mock/P815, B7-H1/P815 or ΔB7-H1/P815 cells on day 0. Mice were then treated intraperitoneally with 200 μg control IgG or anti–mouse CD137 mAb (clone 2A) at days 7 and 10. Each point is the mean of 10 with SD. The data are representative of at least 3 experiments.
Figure 6
Figure 6
B7-H1 transmits an antiapoptotic signal to tumor cells. (A) B7-H1/P815 were cultured in the wells, which were precoated with either control IgG (Ctl Ig) or murine PD-1Ig (PD-1Ig) at 5 μg/mL for 18 hours. After extensive washing, cells were labeled with 51Cr and further incubated with activated PD-102C CTLs at indicated E/T ratios for 4 hours. CTL activity was determined in a 51Cr release assay. Each point is the mean of triplicates with SD. The data are representative of at least 3 experiments. (B) PD-1 stimulation of B7-H1+ tumor cells does not change the expression of Fas. The expression of Fas on mock/P815 or B7-H1/P815 cells before and after culture with immobilized murine PD-1Ig was determined by antimurine Fas mAb in flow cytometric analysis as described above. (C) PD-1 stimulation reduced the susceptibility of tumor cells to Fas mAb-mediated apoptosis. Mock/P815 or B7-H1/P815 cells were cultured in the presence of immobilized control IgG or murine PD-1Ig (5 μg/mL) for 18 hours. After extensive washing, cells were then transferred to the wells coated with anti-mouse Fas antibody (5 μg/mL). After 48 hours of culture, the cells were subjected to an annexin-V and PI binding assay. Mock/P815 without treatment was served as negative control (control). (D) PD-1 stimulation reduced the susceptibility of tumor cells to STP-induced apoptosis. B7-H1/P815 cells were cultured in the presence of immobilized control IgG or murine PD-1Ig (5 μg/mL) for 18 hours. After extensive washing, cells were treated with STP at 0.25 μM for 8 hours and subjected to an annexin-V binding assay. The numbers in the graph indicate the percentage of annexin-V+ or annexin-V+ and PI+ cells.

References

    1. Zitvogel L, Tesniere A, Kroemer G. Cancer despite immunosurveillance: immunoselection and immunosubversion. Nat Rev Immunol. 2006;6:715–727. - PubMed
    1. Friedl P, Wolf K. Tumour-cell invasion and migration: diversity and escape mechanisms. Nat Rev Cancer. 2003;3:362–374. - PubMed
    1. Garrido F, Cabrera T, Concha A, et al. Natural history of HLA expression during tumour development. Immunol Today. 1993;14:491–499. - PubMed
    1. Liotta LA, Steeg PS, Stetler-Stevenson WG. Cancer metastasis and angiogenesis: an imbalance of positive and negative regulation. Cell. 1991;64:327–336. - PubMed
    1. Hakomori S. Tumor malignancy defined by aberrant glycosylation and sphingo(glyco)lipid metabolism. Cancer Res. 1996;56:5309–5318. - PubMed

Publication types

MeSH terms