. 2008 Feb;14(2):144-53.
doi: 10.1038/nm1717. Epub 2008 Jan 27.

Dual role of proapoptotic BAD in insulin secretion and beta cell survival

Affiliations

Dual role of proapoptotic BAD in insulin secretion and beta cell survival

Nika N Danial et al. Nat Med. 2008 Feb.

Abstract

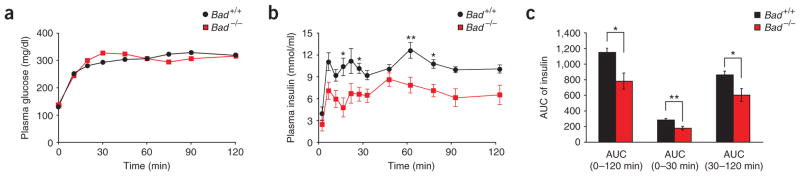
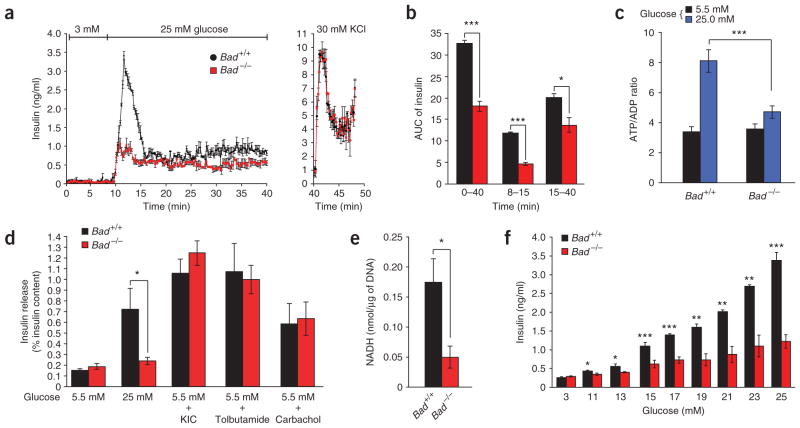
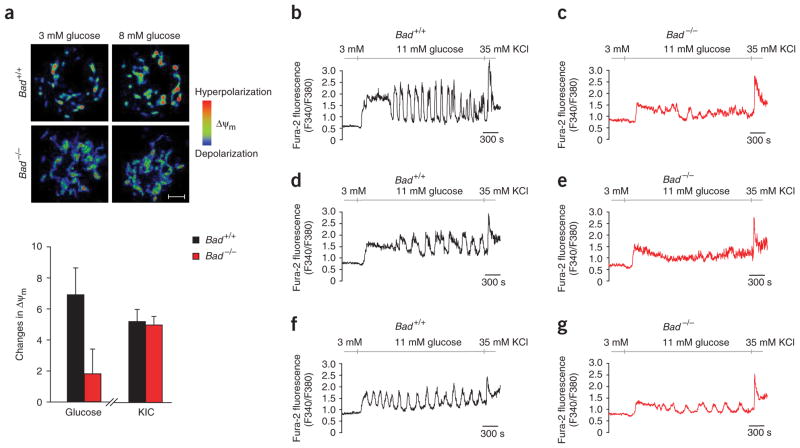
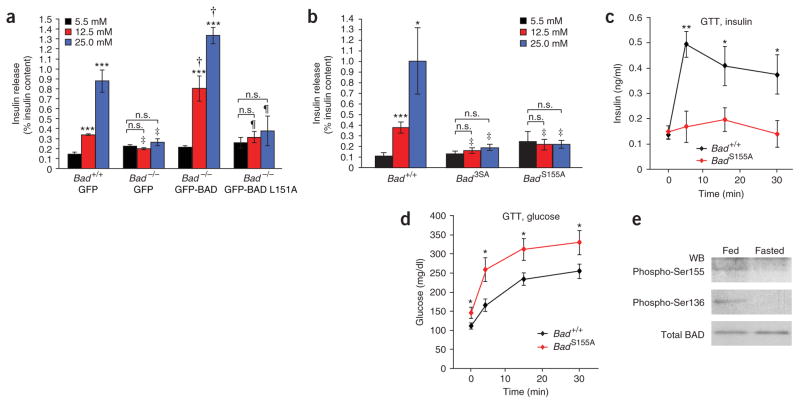
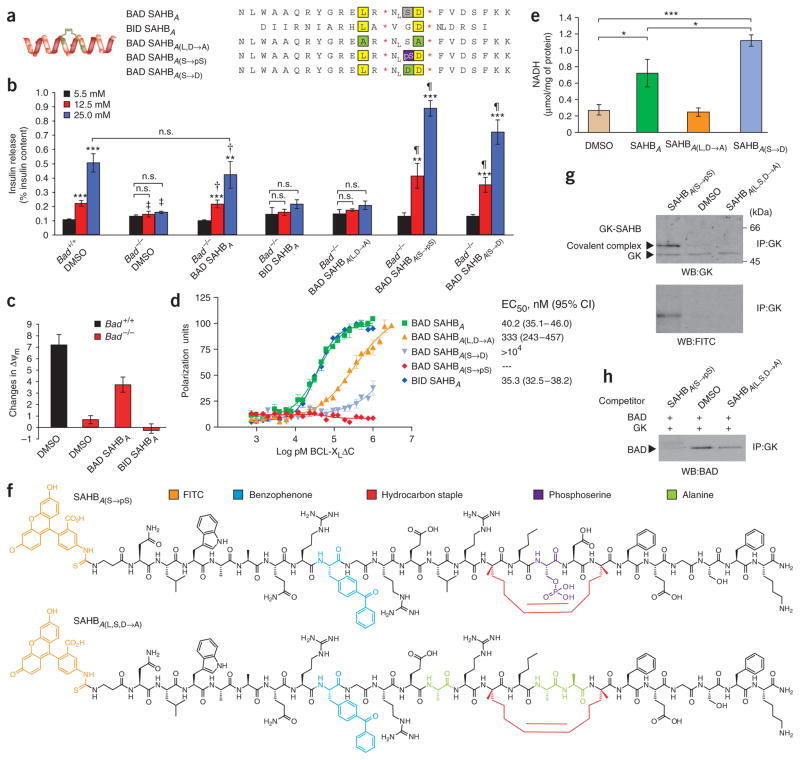
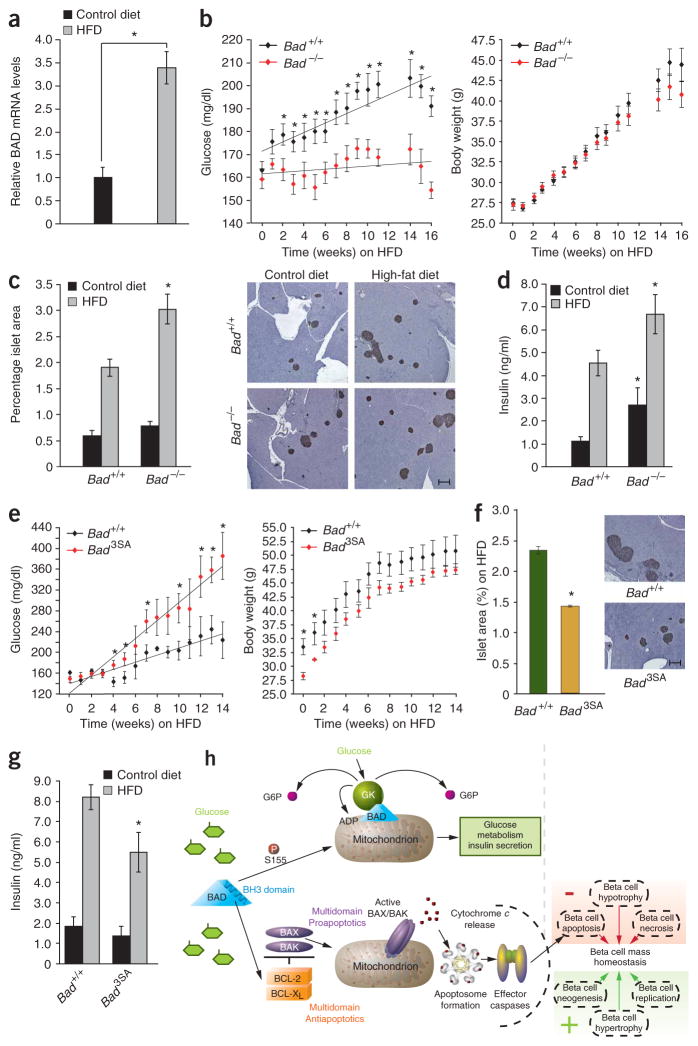
The proapoptotic BCL-2 family member BAD resides in a glucokinase-containing complex that regulates glucose-driven mitochondrial respiration. Here, we present genetic evidence of a physiologic role for BAD in glucose-stimulated insulin secretion by beta cells. This novel function of BAD is specifically dependent upon the phosphorylation of its BH3 sequence, previously defined as an essential death domain. We highlight the pharmacologic relevance of phosphorylated BAD BH3 by using cell-permeable, hydrocarbon-stapled BAD BH3 helices that target glucokinase, restore glucose-driven mitochondrial respiration and correct the insulin secretory response in Bad-deficient islets. Our studies uncover an alternative target and function for the BAD BH3 domain and emphasize the therapeutic potential of phosphorylated BAD BH3 mimetics in selectively restoring beta cell function. Furthermore, we show that BAD regulates the physiologic adaptation of beta cell mass during high-fat feeding. Our findings provide genetic proof of the bifunctional activities of BAD in both beta cell survival and insulin secretion.


Figures

Figure 1
Figure 1
Impaired insulin secretion in Bad −/− mice. Plasma glucose (a) and insulin (b) levels and the area under the curve (AUC) for insulin secretion (c) during hyperglycemic clamp studies performed on overnight fasted Bad +/+ (n = 10) and Bad −/− (n = 12) mice. *P < 0.05, **P < 0.01, Bad +/+ versus Bad −/− mice, unpaired, two-tailed t-test.
Figure 2
Figure 2
Characterization of the insulin secretion defect in Bad −/− islets. (a) Islet perifusion. Data are means ± s.e.m. of four independent experiments. DNA content per islet was 12.09 ± 0.65 ng and 13.17 ± 0.95 ng for Bad +/+ and Bad −/− mice, respectively. (b) AUC for insulin throughout the perifusion (min 0–40), first phase (min 8–15) and second phase (min 15–40) of release in a. (c) Glucose-induced changes in ATP/ADP ratio in Bad +/+ and Bad −/−islets. (d) Insulin release in response to 10 mM α-ketoisocaproic acid (KIC), 0.25 mM tolbutamide or 0.25 mM carbachol, as measured by static incubation method. Data are means ± s.e.m. of four separate experiments. Insulin content per islet was 115.1 ± 4.64 and 118.49 ± 4.09 ng, Bad +/+ and Bad −/−, respectively. (e) Glucokinase activity in homogenates of primary islets isolated from Bad +/+ and Bad −/− mice. Data represent means ± s.e.m. of four independent measurements. (f) Insulin secretion in Bad +/+ and Bad −/− islets perifused with increasing concentration of glucose. Data are means ± s.e.m. of four independent experiments. *P < 0.05, **P < 0.01, ***P < 0.001, Student’s t-test.
Figure 3
Figure 3
Glucose-induced changes in mitochondrial membrane potential and [Ca2+]i in Bad +/+ and Bad −/− beta cells. (a) Changes in mitochondrial membrane potential (ΔΨm) in response to stimulatory fuels (n = 10). Images on the top are color-coded for fluorescence intensity: blue (low) and red (high). Scale bar, 5 μm. (b–g) Representative Ca2+ traces obtained from individual Bad +/+ (n = 116) and Bad −/− (n = 115) islet cells in response to 11 mM glucose and 35 mM KCl. Cells representing at least four different mice from each genotype were analyzed. Quantitative summary of the [Ca2+]i response is provided in Supplementary Table 1 online.
Figure 4
Figure 4
Regulation of GSIS by the BAD BH3 domain and its phosphorylation status. (a) Genetic reconstitution of the GSIS defect in Bad −/− islets. Data are means ± s.e.m. of three separate experiments performed with two independent preparations of viral stocks. n.s., not significant. Asterisks compare release at 5.5 mM versus 12.5 or 25 mM glucose within each group of islets, ***P < 0.001. P < 0.05, comparing Bad +/+ versus Bad −/− islets infected with control (GFP) viruses; P < 0.001, comparing Bad −/− islets infected with control viruses versus viruses expressing wild-type BAD; P < 0.05, comparing Bad −/− islets infected with viruses expressing wild-type BAD versus viruses expressing the L151A mutant. Insulin content per islet was 122.75 ± 12.34 and 127.13 ± 5.09 ng, Bad +/+ and Bad −/−, respectively. (b) GSIS in Bad +/+, Bad 3SA and Bad S155A islets. Data are means ± s.e.m. of three independent experiments. Asterisks compare release at 5.5 mM versus 12.5 or 25 mM glucose within each group of islets, *P < 0.05, ***P < 0.001. P < 0.05, Bad +/+ versus Bad 3SA or Bad +/+ versus Bad S155A. Insulin content per islet was 118.74 ± 3.86, 96.46 ± 3.42 and 106.5 ± 6.24 ng, Bad +/+, Bad3SA and Bad S155A, respectively. (c,d) Blood insulin (c) and glucose (d) abundance after intraperitoneal glucose tolerance test performed on Bad +/+ (n = 10) and Bad S155A (n = 10) mice. *P < 0.05, **P < 0.01, Bad +/+ versus Bad S155A mice, Student’s t-test. (e) BAD phosphorylation status in islets isolated from fed or overnight fasted mice. The ratio of phospho-BAD to total BAD in fed versus fasted state was 0.72 versus 0.01 for Ser155 and 0.80 versus 0.03 for Ser136. WB, western blot.
Figure 5
Figure 5
Metabolic activity of SAHB compounds in beta cells. (a) Panel of human SAHBs generated for islet treatment. Conserved leucine and aspartic acid residues are highlighted in yellow and serine is marked in gray. Residues altered in different SAHB compounds are marked in green and purple. NL, norleucine. *The S5 non-natural amino acid (see Methods). (b) Effect of 3 μM SAHB on GSIS. Data are means ± s.e.m. of five independent experiments. Asterisks compare release at 5.5 mM versus 12.5 or 25 mM glucose within each group of islets, **P < 0.01, ***P < 0.001. P < 0.05 or P < 0.001, Bad +/+ versus Bad −/− islets treated with vehicle. P < 0.05 or P < 0.01, Bad −/− islets treated with vehicle versus BAD SAHBA. P < 0.05 or P < 0.01, Bad −/− islets treated with BAD SAHBA versus phosphomimetic SAHBs (SAHBA(S→pS) or SAHBA(S→D)). Insulin content per islet was 114.61 ± 5.18 and 105.54 ± 4.63 ng, Bad +/+ and Bad −/−, respectively. (c) Effect of 1 μM SAHB compounds on glucose-induced changes in ΔΨm. (d) Binding affinities of SAHBs to recombinant BCL-XL ΔC protein. (e) Effect of 3 μM SAHBs on glucokinase activity in INS-1 cells. *P < 0.05 and ***P < 0.001. (f) Panel of derivatized mouse SAHBs containing a photoactivatable benzophenone moiety. (g) Identification of glucokinase as a direct BAD BH3 target. Formation of a covalent complex between SAHBA(S→pS) and glucokinase upon UV photoactivation. (h) Competition of SAHB compounds with full-length IVTT BAD for binding to IVTT glucokinase. IP, immunoprecipitation.
Figure 6
Figure 6
Sensitivity of Bad genetic models to HFD. (a) Relative islet Bad mRNA levels in wild-type mice on HFD for 16 weeks. *P < 0.05. (b) Weekly blood glucose (left) and body weights (right) of Bad +/+ and Bad −/−(n = 20) treated with HFD for 16 weeks. (c) Percentage islet area of cohorts in b. Representative pancreatic sections developed with an antibody to insulin are shown on the right. Scale bar, 250 μm. (d) Fed blood insulin levels of Bad +/+ and Bad −/− on control or HF diet for 8 weeks. *P < 0.05, Bad −/− versus Bad +/+. (e) Weekly blood glucose (left) and body weights (right) of a cohort of Bad +/+ and Bad 3SA (n = 8) treated with HFD for 16 weeks. (f) Percentage islet area of cohorts in e. Scale bar, 250 μm. (g) Fed blood insulin levels of Bad +/+ and Bad 3SA on control or HFD for 8 weeks. *P < 0.05, Bad 3SA versus Bad +/+ on HFD. (h) Proposed model for dual role of BAD in insulin secretion and beta cell survival. The BH3 domain endows BAD with bifunctional activities in GSIS and apoptosis. Ser155 phosphorylation in this domain instructs BAD to assume a metabolic role by targeting glucokinase and regulating insulin secretion. When dephosphorylated, BAD BH3 targets BCL-XL to control apoptosis. Apoptosis, together with other negative and positive regulators of beta cell growth, proliferation and survival contribute to physiologic control of beta cell mass.

References

    1. Green DR, Kroemer G. The pathophysiology of mitochondrial cell death. Science. 2004;305:626–629. - PubMed
    1. Danial NN, et al. BAD and glucokinase reside in a mitochondrial complex that integrates glycolysis and apoptosis. Nature. 2003;424:952–956. - PubMed
    1. Plas DR, Thompson CB. Cell metabolism in the regulation of programmed cell death. Trends Endocrinol Metab. 2002;13:75–78. - PubMed
    1. Pinton P, Rizzuto R. Bcl-2 and Ca2+ homeostasis in the endoplasmic reticulum. Cell Death Differ. 2006;13:1409–1418. - PubMed
    1. Karbowski M, Norris KL, Cleland MM, Jeong SY, Youle RJ. Role of Bax and Bak in mitochondrial morphogenesis. Nature. 2006;443:658–662. - PubMed

Publication types

MeSH terms