. 2008 Feb;14(2):194-8.
doi: 10.1038/nm1709. Epub 2008 Jan 27.

Oxidative damage-induced inflammation initiates age-related macular degeneration

Affiliations

Oxidative damage-induced inflammation initiates age-related macular degeneration

Joe G Hollyfield et al. Nat Med. 2008 Feb.

Abstract

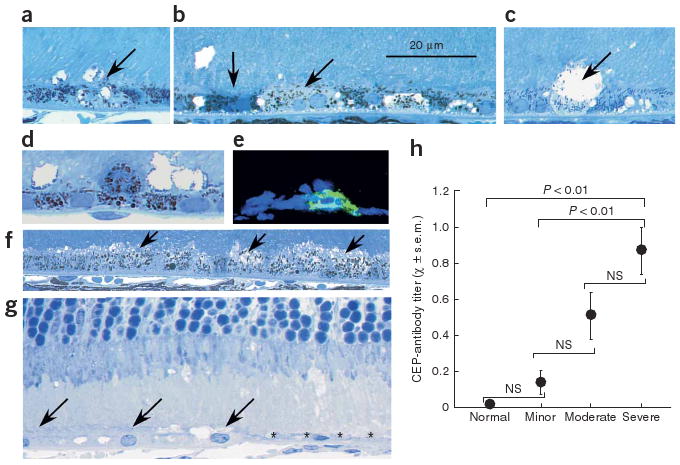
Oxidative damage and inflammation are postulated to be involved in age-related macular degeneration (AMD). However, the molecular signal(s) linking oxidation to inflammation in this late-onset disease is unknown. Here we describe AMD-like lesions in mice after immunization with mouse serum albumin adducted with carboxyethylpyrrole, a unique oxidation fragment of docosahexaenoic acid that has previously been found adducting proteins in drusen from AMD donor eye tissues and in plasma samples from individuals with AMD. Immunized mice develop antibodies to this hapten, fix complement component-3 in Bruch's membrane, accumulate drusen below the retinal pigment epithelium during aging, and develop lesions in the retinal pigment epithelium mimicking geographic atrophy, the blinding end-stage condition characteristic of the dry form of AMD. We hypothesize that these mice are sensitized to the generation of carboxyethylpyrrole adducts in the outer retina, where docosahexaenoic acid is abundant and conditions for oxidative damage are permissive. This new model provides a platform for dissecting the molecular pathology of oxidative damage in the outer retina and the immune response contributing to AMD.


Figures

Figure 1
Figure 1
CEP antigen and CEP-specific antibody titers in immunized mice. (a) Drawing of CEP adducted to MSA. (b) SDS-PAGE gel (left) and western blot for CEP (right) showing the MSA (lane 1) and two preparations of the CEP-adducted MSA (lanes 2 and 3, respectively) used. The bolus of the MSA protein in lane 1 is between 66 and 97 kDa. Lanes 2 and 3 show a higher mass range after adduction with CEP. Molar ratios of CEP to MSA were 11:1 in lane 2 and 6.6:1 in lane 3. The western blot shows strong CEP immunoreactivity in lanes 2 and 3. Minor CEP immunoreactivity is present in lane 1 (between the brackets). MWM, molecular weight marker. (c) CEP-specific antibody titer at the end of the short-term protocol (3 months) in each of the six treatment groups. (d) CEP-specific antibody titer at the end of the long-term protocol (12–14 months) in mice immunized with CEP-MSA or the indicated control treatments. Paired comparisons between CEP-MSA and all other groups are indicated with P values. NS, not significant.
Figure 2
Figure 2
Relationship between pathology and CEP-specific antibody titer in the short-term immunization mice. (ag) Histology of CEP-MSA eyes. The RPE is located across the lower one-third to one-half of each image, and vesiculation of RPE cells is evident (oblique arrows in ac and f). Darkly staining RPE cells are present, suggesting pyknosis (vertical arrow, lower left of b). RPE lysis is shown in b and c. A monocyte is located above the RPE layer in d. In e, frozen section stained with the macrophage marker F4/80 is shown. In f, several adjacent RPE cells (arrows) show vesiculation similar to that in a and b. In g, a portion of the RPE layer in a BALB/c mouse is absent (* *) but present on the left (arrows), and the photoreceptors above the RPE-free area are swollen. (h) Comparison of RPE pathology and CEP-specific antibody titer. Only the antibody titers of the severe group were different (at the indicated P values) when tested against the antibody titers in the normal and minor pathology groups.
Figure 3
Figure 3
C3d localization in the outer eye wall of the short-term immunization mice. (a) Frozen section showing the four tissue lamina in a differential interference contrast image. (be) Confocal images of Bruch's membrane in mice. (b) Confocal image of the outer eye wall from a CEP-MSA–immunized mouse showing the bright green fluorescence of the C3d-FITC probe along Bruch's membrane (arrow). (c) Image from another CEP-MSA–immunized mouse in an area where Bruch's membrane (arrow) labeling is not pronounced but intense C3d labeling is associated with two lysed RPE cells (on upper left of image) with profiles similar to those illustrated in the histology presented in Figure 2b–d. (d) Minor C3d labeling of Bruch's membrane (arrow) is present in a mouse immunized with non-adducted MSA. Differences in intensity and distribution of FITC fluorescence are present in b, c and d. (e) No C3d localization is evident in Bruch's membrane (arrow) in a naive mouse. Red fluorescence is the nuclear stain propidium iodide. Fluorescent intensity in an MSA immunized mouse (f) and a CEP-MSA-immunized mouse (g) was measured in the overlays shown. The long axis on the overlay represents 150 μm. Images in ag are at identical magnification. (h) C3d fluorescence intensity from the groups specified. C3d immunofluorescence in the CEP-MSA group is five to six times higher than in the other groups.
Figure 4
Figure 4
Light and electron microscopy of the RPE–Bruch's membrane interface with quantitative comparisons. (ad) Light microscopy images. Images in a and c are from the 1-year naive control mouse, and images in b and d are from the long-term CEP-MSA mice. The basal side of the RPE in a is thinner than in b. In c and d this sub-RPE area is delineated by two lines (shown in red). Images in ad are at identical magnification. (e,f) Area comparisons of basal RPE infoldings in short-term (e) and long-term (f) mice. (g,h) Electron micrographs of the interface between RPE and Bruch's membrane from a 1-year naive control mouse (g) and a 1-year CEP-MSA–immunized mouse (h). The RPE basal lamina is aligned along the horizontal double arrow. The basal lamina of the choriocapillaris is thicker than that of the RPE and is indicated in both images by the oblique double arrow. Bruch's membrane in h is thicker than in g, shown by the length of the vertical line across Bruch's membrane on the left in g and right in h. The height of the basal infoldings is indicated by the vertical line along the right margin of g. In g, basal infoldings are evident as parallel membranes, but in h they surround a flocculent, fluffy material that appears to be extracellular. The vertical bar length along the left side of this debris zone in h is greater than the length of the vertical bar on the right side of the basal infoldings in g.

References

    1. Crabb JW, et al. Drusen proteome analysis: an approach to the etiology of age-related macular degeneration. Proc Natl Acad Sci USA. 2002;99:14682–14687. - PMC - PubMed
    1. Gu X, et al. Carboxyethylpyrrole protein adducts and autoantibodies, biomarkers for age-related macular degeneration. J Biol Chem. 2003;278:42027–42035. - PubMed
    1. Javitt JC, Zhou Z, Maguire MG, Fine SL, Willke RJ. Incidence of exudative age-related macular degeneration among elderly Americans. Ophthalmology. 2003;110:1534–1539. - PubMed
    1. Augood CA, et al. Prevalence of age-related maculopathy in older Europeans: the European Eye Study (EUREYE) Arch Ophthalmol. 2006;124:529–535. - PubMed
    1. Hageman GS, et al. An integrated hypothesis that considers drusen as biomarkers of immune-mediated processes at the RPE-Bruch's membrane interface in aging and age-related macular degeneration. Prog Retin Eye Res. 2001;20:705–732. - PubMed

Publication types

MeSH terms