. 2008 Jan;4(1):e13.
doi: 10.1371/journal.pcbi.0040013. Epub 2007 Dec 13.

Genomic sequence is highly predictive of local nucleosome depletion

Affiliations

Genomic sequence is highly predictive of local nucleosome depletion

Guo-Cheng Yuan et al. PLoS Comput Biol. 2008 Jan.

Abstract

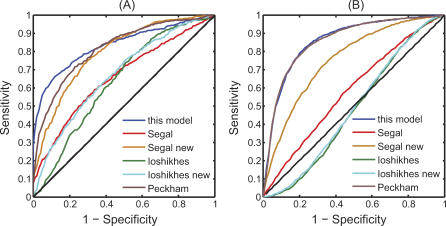
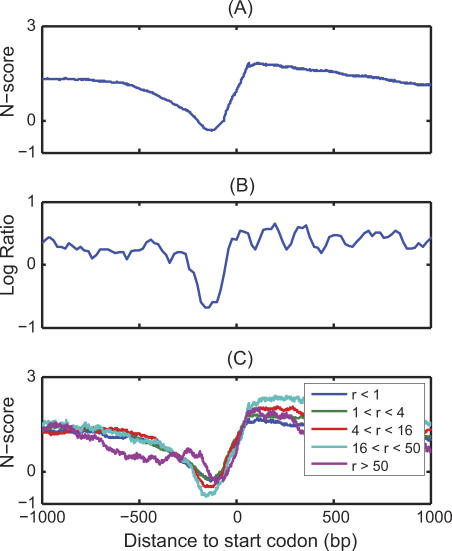
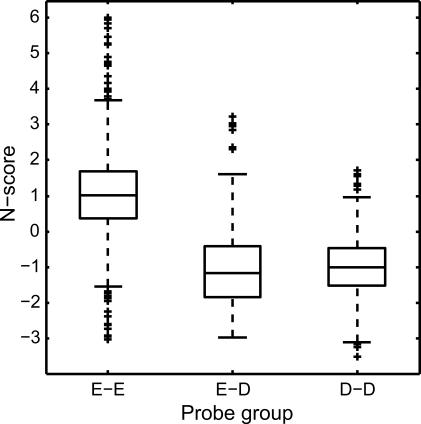
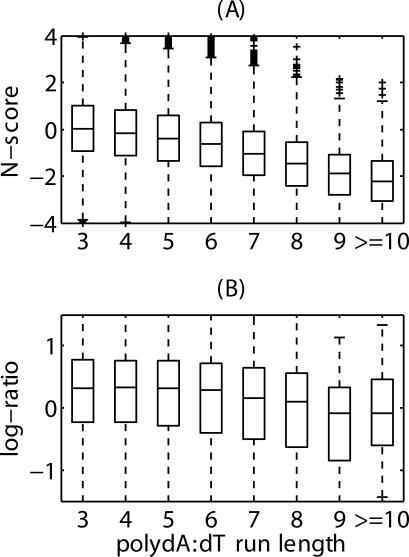
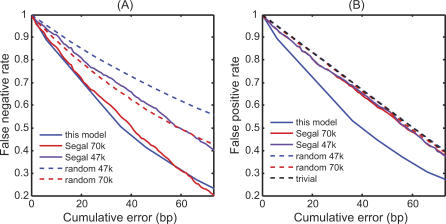
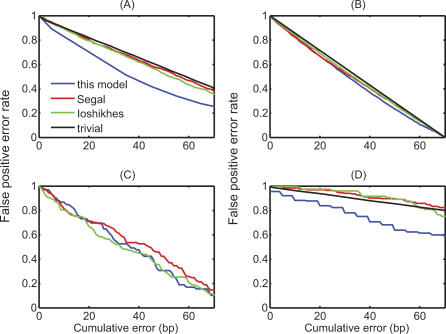
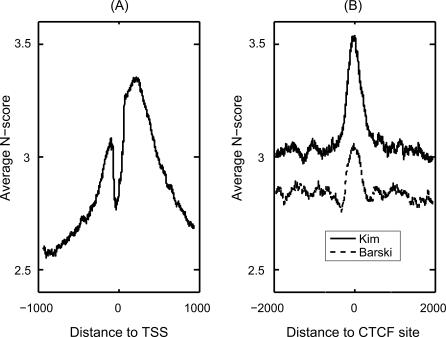
The regulation of DNA accessibility through nucleosome positioning is important for transcription control. Computational models have been developed to predict genome-wide nucleosome positions from DNA sequences, but these models consider only nucleosome sequences, which may have limited their power. We developed a statistical multi-resolution approach to identify a sequence signature, called the N-score, that distinguishes nucleosome binding DNA from non-nucleosome DNA. This new approach has significantly improved the prediction accuracy. The sequence information is highly predictive for local nucleosome enrichment or depletion, whereas predictions of the exact positions are only modestly more accurate than a null model, suggesting the importance of other regulatory factors in fine-tuning the nucleosome positions. The N-score in promoter regions is negatively correlated with gene expression levels. Regulatory elements are enriched in low N-score regions. While our model is derived from yeast data, the N-score pattern computed from this model agrees well with recent high-resolution protein-binding data in human.


Conflict of interest statement

Competing interests. The authors have declared that no competing interests exist.

Figures

Figure 1
Figure 1. Comparison of the Performance of the Nucleosome Scores from Different Models
“This model” refers to the N-score in this paper; “Segal” refers to the apparent free energy score in Segal et al. [7]; and “Segal new” refers to a modified version of Segal's model. The modified apparent free energy score is the log-ratio of the likelihoods of the nucleosome model and the linker model; “Ioshikhes” refers to the NPS score in Ioshikhes et al. [25]; “Ioshikhes new” refers to the same as “Ioshikhes,” except that the NPS pattern was recalculated from the training nucleosome sequences; “Peckham” refers to the support vector machine generated discriminant score using the method in Peckham et al. [26] (A) Cross-validation of model performance in discriminating nucleosome from linker sequences. The plotted ROC curves represent the average performance over five independent rounds of 2-fold cross-validations. (B) Model performance in discriminating nucleosome-enriched probes from -depleted probes in Pokholok et al [4]. The nucleosome scores for (B) are averaged over 300 bp windows.
Figure 2
Figure 2. The Average Promoter N-Score Pattern
(A) The average N-score pattern over promoters for all verified non–chromosome III genes. Promoters are aligned by the ATG codon. (B) The average log-ratio over non–chromosome III promoters probed by the tiling array [6]. (C) Same as (A), except that promoters are divided into groups according to the gene transcription rate r (in mRNA/h) as in Holstege et al. [29] Different curves correspond to different gene groups.
Figure 3
Figure 3. Correlation Between N-Score and H2O2-Induced Nucleosome Occupancy
The box-plot is drawn using the default setting in MATLAB. Coding for the probe groups: E-E, enriched in both YPD and H2O2 growth conditions; E-D, enriched in one but depleted in the other growth condition; D-D, depleted in both growth conditions [4].
Figure 4
Figure 4. Correlation Between Poly dA:dT Run Length and N-Score, and the BLAST-Entropy Normalized Log-Ratio in Yuan et al. [6]
(A) N-score. (B) BLAST-entropy normalized log-ratio in Yuan et al. [6]
Figure 5
Figure 5. Comparison of the Accuracies of the Predicted Non–Chromosome III Nucleosome Positions Obtained from Segal's [7] and Our Model
(A) False negative error rates; (B) false positive error rates. “Random” refers to a random permutation of prediction nucleosomes. “Trivial” means every base pair coordinate is predicted as a nucleosome position. “70k” or “47k” refers to the number of predicted nucleosome positions involved in the comparison. For Segal's model, the top-ranked nucleosomes were selected. Our model predicts a total of 47,000 non–chromosome III nucleosome positions.
Figure 6
Figure 6. Comparison of the False Positive Error Rates of Predicted Nucleosome Positions Obtained from Different Models
(A) Validation with the tiling array data [6]. (B) Validation with the sequencing data [8]. (C) Validation with literature positions as in [7]. Again, a trivial model means every base pair coordinate is predicted as a nucleosome position. (D) Validation of predicted NFR positions with the tiling array data [6]. NFRs are defined as linkers that are longer than 100 bp. Prediction errors are measured by center-to-center distances.
Figure 7
Figure 7. Application of the N-Score Model Derived from the Yeast Data to the Human Genome
(A) The average N-score pattern for all human promoters aligned by TSS [39]. (B) The average N-score pattern aligned by CTCF binding sites [13,38].

References

    1. Kornberg RD, Lorch Y. Twenty-five years of the nucleosome, fundamental particle of the eukaryote chromosome. Cell. 1999;98:285–294. - PubMed
    1. Bernstein BE, Liu CL, Humphrey EL, Perlstein EO, Schreiber SL. Global nucleosome occupancy in yeast. Genome Biol. 2004;5:R62. - PMC - PubMed
    1. Lee CK, Shibata Y, Rao B, Strahl BD, Lieb JD. Evidence for nucleosome depletion at active regulatory regions genome-wide. Nat Genet. 2004;36:900–905. - PubMed
    1. Pokholok DK, Harbison CT, Levine S, Cole M, Hannett NM, et al. Genome-wide map of nucleosome acetylation and methylation in yeast. Cell. 2005;122:517–527. - PubMed
    1. Raisner RM, Hartley PD, Meneghini MD, Bao MZ, Liu CL, et al. Histone variant H2A.Z marks the 5′ ends of both active and inactive genes in euchromatin. Cell. 2005;123:233–248. - PMC - PubMed

Publication types

LinkOut - more resources