Review
. 2008;10(1):201.
doi: 10.1186/bcr1831. Epub 2008 Jan 9.

Mammographic density. Potential mechanisms of breast cancer risk associated with mammographic density: hypotheses based on epidemiological evidence

Affiliations
Review

Mammographic density. Potential mechanisms of breast cancer risk associated with mammographic density: hypotheses based on epidemiological evidence

Lisa J Martin et al. Breast Cancer Res. 2008.

Abstract

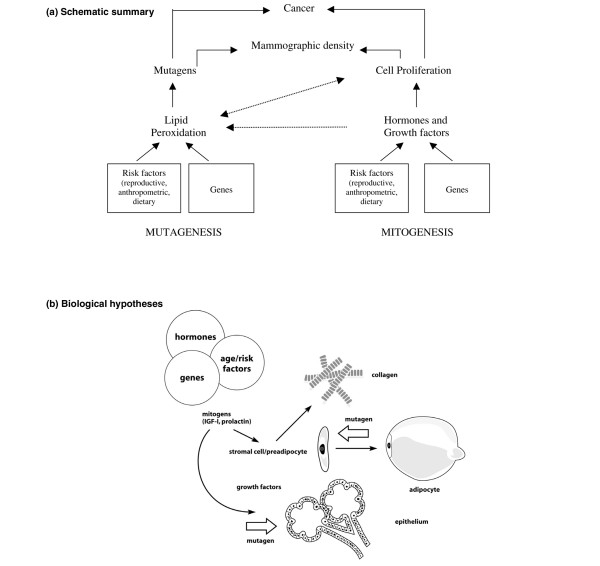
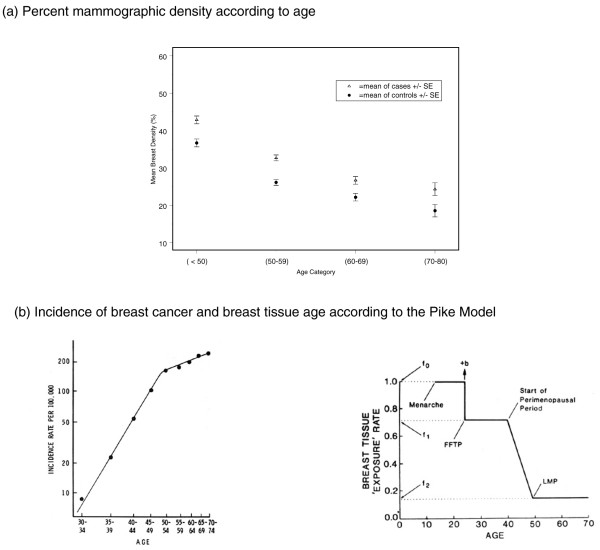
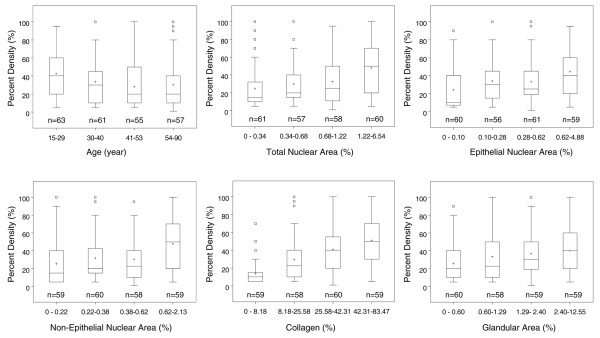
There is now extensive evidence that mammographic density is an independent risk factor for breast cancer that is associated with large relative and attributable risks for the disease. The epidemiology of mammographic density, including the influences of age, parity and menopause, is consistent with it being a marker of susceptibility to breast cancer, in a manner similar to the concept of 'breast tissue age' described by the Pike model. Mammographic density reflects variations in the tissue composition of the breast. It is associated positively with collagen and epithelial and nonepithelial cells, and negatively with fat. Mammographic density is influenced by some hormones and growth factors as well as by several hormonal interventions. It is also associated with urinary levels of a mutagen. Twin studies have shown that most of the variation in mammographic density is accounted for by genetic factors. The hypothesis that we have developed from these observations postulates that the combined effects of cell proliferation (mitogenesis) and genetic damage to proliferating cells by mutagens (mutagenesis) may underlie the increased risk for breast cancer associated with extensive mammographic density. There is clearly a need for improved understanding of the specific factors that are involved in these processes and of the role played by the several breast tissue components that contribute to density. In particular, identification of the genes that are responsible for most of the variance in percentage density (and of their biological functions) is likely to provide insights into the biology of the breast, and may identify potential targets for preventative strategies in breast cancer.


Figures

Figure 1
Figure 1
Hypotheses. (a) Schematic summary. We postulate that the combined effects of cell proliferation (mitogenesis) and genetic damage to proliferating cells caused by mutagens (mutagenesis) may underlie the increased risk for breast cancer associated with extensive mammographic density. Mitogenesis and mutagenesis are related processes. Increased cell proliferation increases susceptibility to mutations but also increases lipid peroxidation, which can in turn increase cell proliferation (see text). (b) Biological hypothesis. The tissue components (epithelial cells, stromal cells, collagen and fat) that are responsible for variations in mammographic density are related to each other in several ways. Stromal fibroblasts produce collagen, and some are pre-adiopocytes that differentiate into adipocytes. Stromal and epithelial cells influence each other through paracrine growth factors, and both cell types are influenced by endocrine stimuli to cell proliferation (mitogenesis). Genetic damage to either stromal or epithelial cells caused by mutagens (mutagenesis) could initiate carcinogenesis (see text).
Figure 2
Figure 2
Age, mammographic density and the incidence of breast cancer. (a) Baseline percentage mammographic density in women from three mammographic screening programmes according to those who developed breast cancer 1 to 8 years later (cases) or remained free from breast cancer (control individuals). Average percentage density in the baseline mammogram declined with increasing age at enrolment, both in women who eventually developed breast cancer and in those who remained free from disease. At all ages, percentage density was greater in those who developed breast cancer. Data from Boyd and coworkers [4]. (b) On the left is shown a log-log plot of the age-specific incidence of breast cancer. Adapted from Pike and coworkers [6]. To the right is shown the Pike model of breast tissue ageing. 'b' represents a one time increase in risk associated with first full-term pregnancy (FFTP). See Pike and coworkers [6]. LMP, last menstrual period.
Figure 3
Figure 3
Parity and mammographic density. Least square means of percentage mammographic density according to number of live births, adjusted for age, body mass index, age at menarche, age at first birth, menopausal status, age at menopause, previous use of menopausal hormone therapy (ever/never) and breast cancer in first degree relatives (0, 1, 2+). The height of the bar is the least square mean of percentage density, and half width of the error bar represents the standard error. Data from Boyd and coworkers [4].
Figure 4
Figure 4
Percentage mammographic density, age, and histological measures. Boxplots showing the associations of percentage density with age and histological measures. Median is shown by a horizontal line, mean by the '+' symbol, interquartile range by the columns, 1.5× the interquartile range by the whiskers, and outliers are shown separately. P values from linear regression, using continuous variables adjusted for age, were as follows: age, P = 0.04; total nuclear area, P < 0.001; epithelial nuclear area, P ≤ 0.001; nonepithelial nuclear area, P < 0.001; collagen, P < 0.001; glandular area, P < 0.001. Data from Li and coworkers [11].

References

    1. Wolfe JN. Breast patterns as an index of risk for developing breast cancer. A J Roentgenol. 1976;126:1130–1137. - PubMed
    1. Wolfe JN. Risk for breast cancer development determined by mammographic parenchymal pattern. Cancer. 1976;37:2486–2492. doi: 10.1002/1097-0142(197605)37:5<2486::AID-CNCR2820370542>3.0.CO;2-8. - DOI - PubMed
    1. McCormack VA, dos Santos Silva I. Breast density and parenchymal patterns as markers of breast cancer risk: a meta-analysis. Cancer Epidemiol Biomarkers Prev. 2006;15:1159–1169. doi: 10.1158/1055-9965.EPI-06-0034. - DOI - PubMed
    1. Boyd NF, Guo H, Martin LJ, Sun L, Stone J, Fishell E, Jong RA, Hislop G, Chiarelli A, Minkin S, Yaffe MJ. Mammographic density and the risk and detection of breast cancer. N Engl J Med. 2007;356:227–236. doi: 10.1056/NEJMoa062790. - DOI - PubMed
    1. Breast Cancer Research Thematic Review Series on Mammographic Density http://breast-cancer-research.com/articles/review-series.asp?series=BCR_...

Substances