. 2008 Jan 28:6:6.
doi: 10.1186/1741-7007-6-6.

Strong mitochondrial DNA support for a Cretaceous origin of modern avian lineages

Affiliations

Strong mitochondrial DNA support for a Cretaceous origin of modern avian lineages

Joseph W Brown et al. BMC Biol. .

Abstract

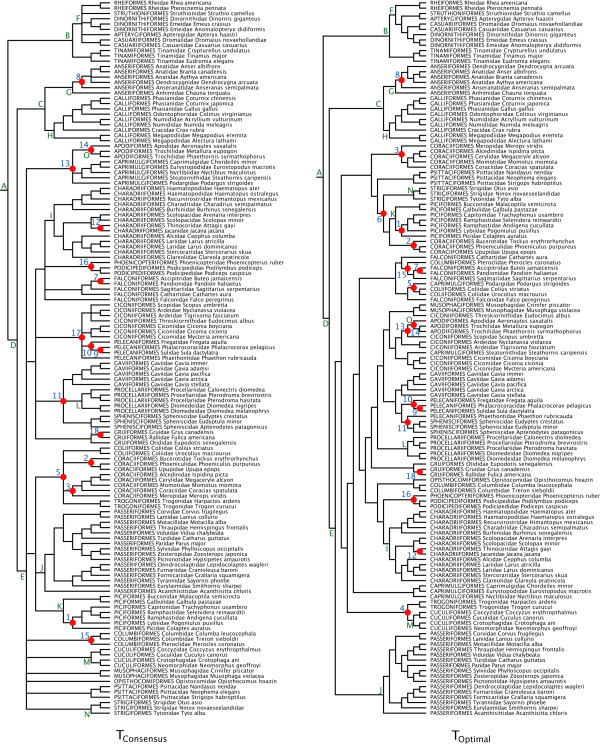
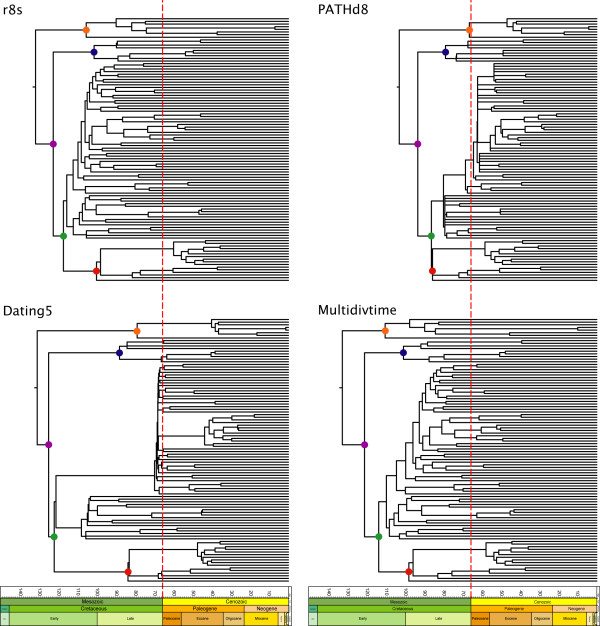
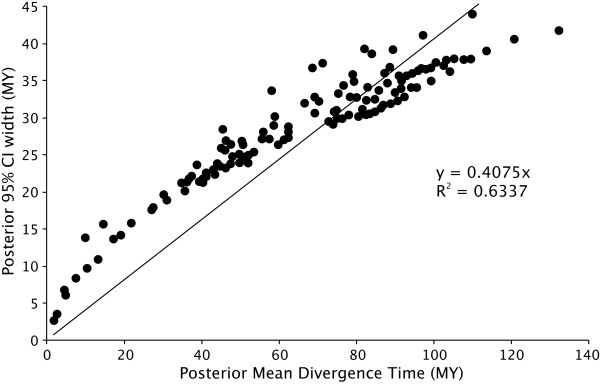
Background: Determining an absolute timescale for avian evolutionary history has proven contentious. The two sources of information available, paleontological data and inference from extant molecular genetic sequences (colloquially, 'rocks' and 'clocks'), have appeared irreconcilable; the fossil record supports a Cenozoic origin for most modern lineages, whereas molecular genetic estimates suggest that these same lineages originated deep within the Cretaceous and survived the K-Pg (Cretaceous-Paleogene; formerly Cretaceous-Tertiary or K-T) mass-extinction event. These two sources of data therefore appear to support fundamentally different models of avian evolution. The paradox has been speculated to reflect deficiencies in the fossil record, unrecognized biases in the treatment of genetic data or both. Here we attempt to explore uncertainty and limit bias entering into molecular divergence time estimates through: (i) improved taxon (n = 135) and character (n = 4594 bp mtDNA) sampling; (ii) inclusion of multiple cladistically tested internal fossil calibration points (n = 18); (iii) correction for lineage-specific rate heterogeneity using a variety of methods (n = 5); (iv) accommodation of uncertainty in tree topology; and (v) testing for possible effects of episodic evolution.

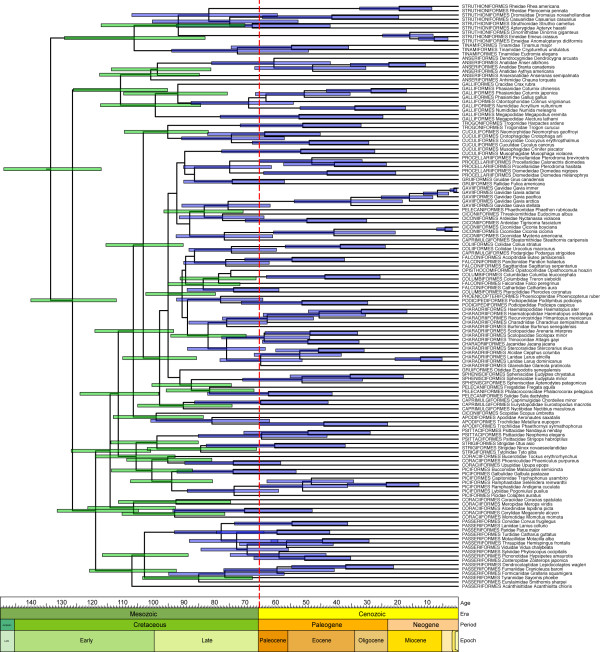
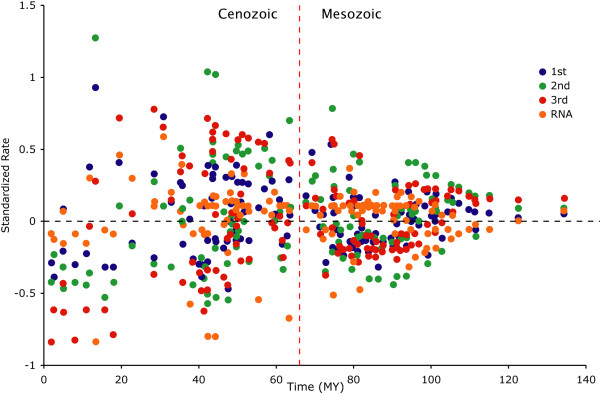
Results: The various 'relaxed clock' methods all indicate that the major (basal) lineages of modern birds originated deep within the Cretaceous, although temporal intraordinal diversification patterns differ across methods. We find that topological uncertainty had a systematic but minor influence on date estimates for the origins of major clades, and Bayesian analyses assuming fixed topologies deliver similar results to analyses with unconstrained topologies. We also find that, contrary to expectation, rates of substitution are not autocorrelated across the tree in an ancestor-descendent fashion. Finally, we find no signature of episodic molecular evolution related to either speciation events or the K-Pg boundary that could systematically mislead inferences from genetic data.

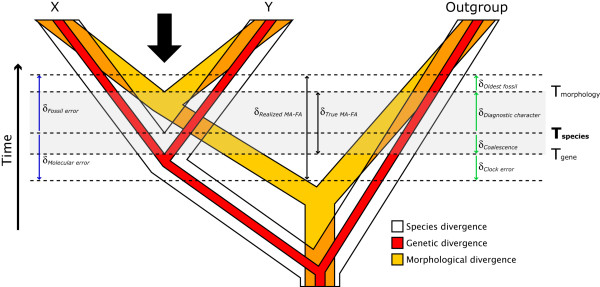
Conclusion: The 'rock-clock' gap has been interpreted by some to be a result of the vagaries of molecular genetic divergence time estimates. However, despite measures to explore different forms of uncertainty in several key parameters, we fail to reconcile molecular genetic divergence time estimates with dates taken from the fossil record; instead, we find strong support for an ancient origin of modern bird lineages, with many extant orders and families arising in the mid-Cretaceous, consistent with previous molecular estimates. Although there is ample room for improvement on both sides of the 'rock-clock' divide (e.g. accounting for 'ghost' lineages in the fossil record and developing more realistic models of rate evolution for molecular genetic sequences), the consistent and conspicuous disagreement between these two sources of data more likely reflects a genuine difference between estimated ages of (i) stem-group origins and (ii) crown-group morphological diversifications, respectively. Further progress on this problem will benefit from greater communication between paleontologists and molecular phylogeneticists in accounting for error in avian lineage age estimates.


Figures

Figure 1
Figure 1
Different ways that fossil and molecular data date lineages. Time intervals defined by the horizontal dashed lines and vertical arrows pertain to age estimates for the divergence between hypothetical lineages X and Y. Even with a complete fossil record and perfect molecular clock a discrepancy is expected between fossil (FA) and molecular (MA) age estimates. As diagnostic morphological characters generally evolve (TMorphology) after species divergence (TSpecies), the fossil record will always underestimate (by δDiagnostic character) the true speciation time. Genetic data, on the other hand, will overestimate speciation time (by δCoalescence), as polymorphisms present during species divergence will coalesce some time in the past (TGene; related to the ancestral species effective population size). The genuine difference between molecular and morphological divergence times will thus be δTrue MA-FA. With a less complete fossil record, the oldest known fossil is unlikely to temporally correspond precisely to the origination of a diagnostic character delimiting X and Y, further decreasing FA by δOldest fossil. Under the more realistic scenario of lineage-specific rate heterogeneity and limited taxon/character sampling, errors associated with molecular methods (δClock error) may result in overestimation or underestimation of the true speciation time, although underestimates are bounded by the fossil constraint (δFossil error). The observed discrepancy in age estimates, δRealized MA-FA, may be considerably larger than expectations (δTrue MA-FA).
Figure 2
Figure 2
Alternative tree topologies. TConsensus (left) represents a conservative consensus estimate of avian familial relationships [53] (AICc = 421460.9166). TOptimal (right) is our optimal topology derived from a partitioned model maximum likelihood search in RAxML (AICc = 414160.2536). Some topological constraints were implemented in this search (see additional file 1). Solid circles and numbers indicate the placement of calibration points (see Table 5 for ages). Letters denote nodes whose age estimates are provided in Table 3.
Figure 3
Figure 3
Comparative timing of divergences for avian orders and families based on four different 'relaxed clock' methods. Chronograms based on the optimal mtDNA tree reconstruction (TOptimal) using r8s (top left), Dating5 (bottom left), PATHd8 (top right) and Multidivtime (bottom right); see methods for explanation of differences between analytical approaches. For legibility, error bars are removed and trees are pruned to the family level. Filled circles denote major clades: orange, Paleognathae; purple, Neognathae; blue, Galloanserae; green, Neoaves; red, Passeriformes. Time is given in millions of years before present. The vertical dashed lines indicate the K-Pg boundary. r8s, Dating5 and Multidivtime reconstructions support Cretaceous origin and diversification. PATHd8 alone supports Cretaceous origin but Tertiary diversification.
Figure 4
Figure 4
A timeline for early avian evolution. Maximum clade credibility (MCC) chronogram inferred using the non-autocorrelated model of rate evolution in BEAST while allowing topology to vary (TFlexible). Time is given in millions of years before present. The vertical dashed line indicates the K-Pg boundary. Error bars (blue and green) represent 95% posterior credibility intervals and are only given for nodes that were present on more than 50% of the posterior sampled trees. An unambiguous ancient diversification is indicated by 37 credibility intervals restricted to the Cretaceous (green bars).
Figure 5
Figure 5
Estimated rates of molecular evolution over time, in assessment of possible episodic evolution. Standardized inferred rate of sequence evolution (per data partition) is plotted against inferred age for internal nodes on the optimal mtDNA tree reconstruction (TOptimal) using Multidivtime. Time is given in millions of years before present. No support is shown for an accelerated rate accompanying initial avian diversification or following the K-Pg boundary (vertical dashed line).
Figure 6
Figure 6
Information content. Posterior 95% credibility interval width is plotted against posterior mean divergence time using the results from Multidivtime on TOptimal. Here R2 indicates the amount of information present in the data matrix and the regression coefficient is an estimate of the expected uncertainty that is independent of sequence length.

References

    1. Archibald JD, Deutschman DH. Quantitative analysis of the timing of the origin and diversification of extant placental orders. J Mamm Evol. 2001;8:107–124. doi: 10.1023/A:1011317930838. - DOI
    1. Cooper A, Fortey R. Evolutionary explosions and the phylogenetic fuse. Trends Ecol Evol. 1998;13:151–156. doi: 10.1016/S0169-5347(97)01277-9. - DOI - PubMed
    1. Penny D, Phillips MJ. The rise of birds and mammals: are microevolutionary processes sufficient for macroevolution? Trends Ecol Evol. 2004;19:516–522. doi: 10.1016/j.tree.2004.07.015. - DOI - PubMed
    1. van Tuinen M, Stidham TA, Hadly EA. Tempo and mode of modern bird evolution observed with large-scale taxonomic sampling. Hist Biol. 2006;18:205–221. doi: 10.1080/08912960600641174. - DOI
    1. Benton MJ, Ayala FJ. Dating the tree of life. Science. 2003;300:1698–1700. doi: 10.1126/science.1077795. - DOI - PubMed

Publication types

Substances

LinkOut - more resources