

Integration of modeling and simulation into hospital-based decision support systems guiding pediatric pharmacotherapy
- PMID: 18226244
- PMCID: PMC2254609
- DOI: 10.1186/1472-6947-8-6
Integration of modeling and simulation into hospital-based decision support systems guiding pediatric pharmacotherapy
Abstract
Background: Decision analysis in hospital-based settings is becoming more common place. The application of modeling and simulation approaches has likewise become more prevalent in order to support decision analytics. With respect to clinical decision making at the level of the patient, modeling and simulation approaches have been used to study and forecast treatment options, examine and rate caregiver performance and assign resources (staffing, beds, patient throughput). There us a great need to facilitate pharmacotherapeutic decision making in pediatrics given the often limited data available to guide dosing and manage patient response. We have employed nonlinear mixed effect models and Bayesian forecasting algorithms coupled with data summary and visualization tools to create drug-specific decision support systems that utilize individualized patient data from our electronic medical records systems.
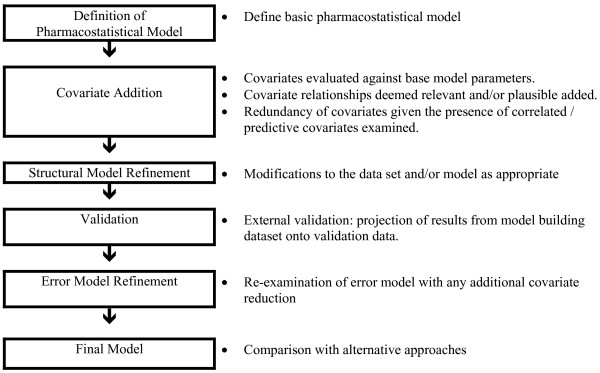
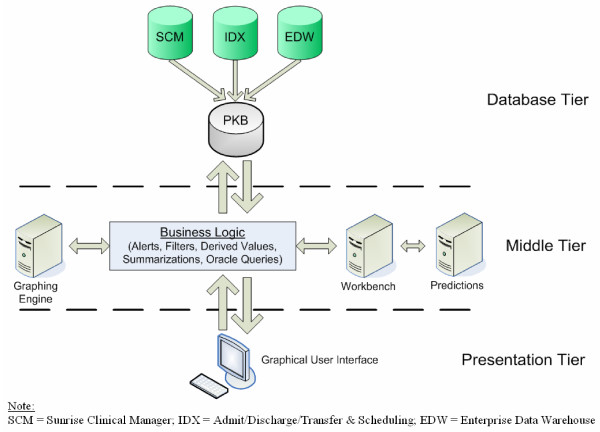
Methods: Pharmacokinetic and pharmacodynamic nonlinear mixed-effect models of specific drugs are generated based on historical data in relevant pediatric populations or from adults when no pediatric data is available. These models are re-executed with individual patient data allowing for patient-specific guidance via a Bayesian forecasting approach. The models are called and executed in an interactive manner through our web-based dashboard environment which interfaces to the hospital's electronic medical records system.
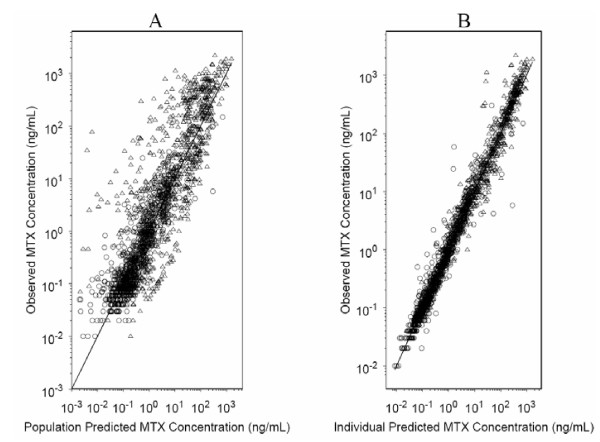
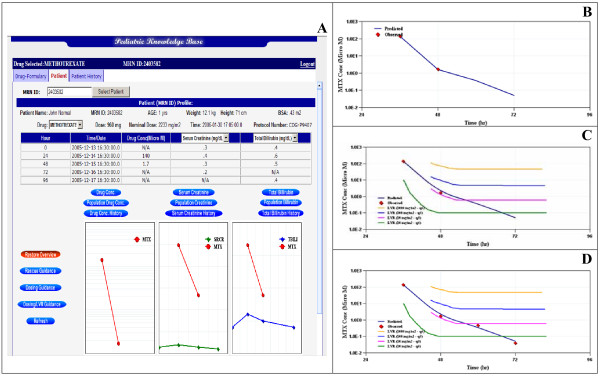
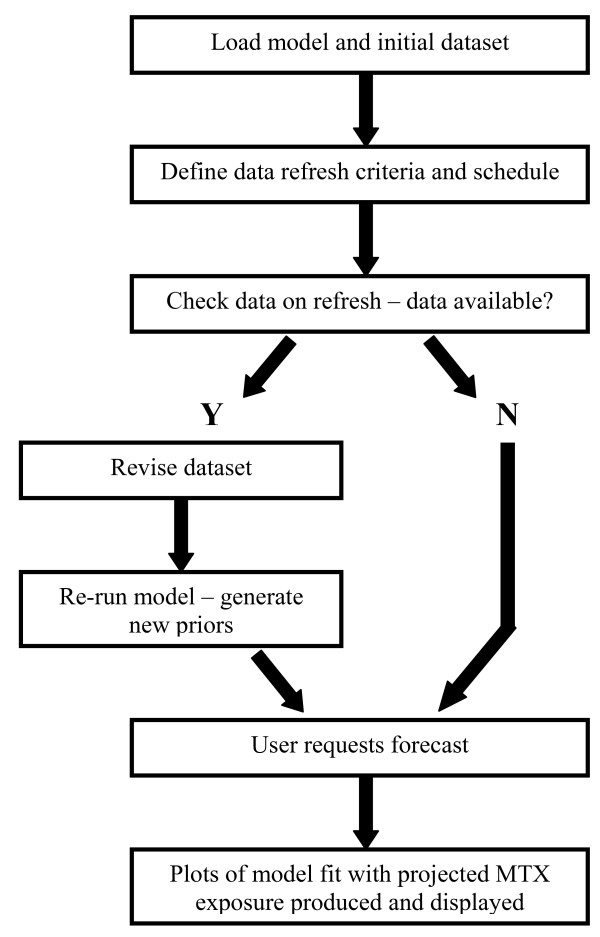
Results: The methotrexate dashboard utilizes a two-compartment, population-based, PK mixed-effect model to project patient response to specific dosing events. Projected plasma concentrations are viewable against protocol-specific nomograms to provide dosing guidance for potential rescue therapy with leucovorin. These data are also viewable against common biomarkers used to assess patient safety (e.g., vital signs and plasma creatinine levels). As additional data become available via therapeutic drug monitoring, the model is re-executed and projections are revised.
Conclusion: The management of pediatric pharmacotherapy can be greatly enhanced via the immediate feedback provided by decision analytics which incorporate the current, best-available knowledge pertaining to dose-exposure and exposure-response relationships, especially for narrow therapeutic agents that are difficult to manage.
Figures
References
-
- IOM . Building a Better Delivery system: A New Engineering/Health Care Partnership. National Academy of Engineering and Institute of Medicine; 2005.
-
- IOM Report: Patient safety – achieving a new standard for care. Acad Emerg Med. 2005;12:1011–2. - PubMed
-
- Ferri F. User modeling techniques as support in the clinical decision-making process. Medinfo. 1995;8:926–30. - PubMed
Publication types
MeSH terms
Substances
LinkOut - more resources
Full Text Sources
Other Literature Sources
Medical
