. 2008 Jan 29;105(4):1232-7.
doi: 10.1073/pnas.0711437105. Epub 2008 Jan 28.

Interaction ruling animal collective behavior depends on topological rather than metric distance: evidence from a field study

Affiliations

Interaction ruling animal collective behavior depends on topological rather than metric distance: evidence from a field study

M Ballerini et al. Proc Natl Acad Sci U S A. .

Abstract

Numerical models indicate that collective animal behavior may emerge from simple local rules of interaction among the individuals. However, very little is known about the nature of such interaction, so that models and theories mostly rely on aprioristic assumptions. By reconstructing the three-dimensional positions of individual birds in airborne flocks of a few thousand members, we show that the interaction does not depend on the metric distance, as most current models and theories assume, but rather on the topological distance. In fact, we discovered that each bird interacts on average with a fixed number of neighbors (six to seven), rather than with all neighbors within a fixed metric distance. We argue that a topological interaction is indispensable to maintain a flock's cohesion against the large density changes caused by external perturbations, typically predation. We support this hypothesis by numerical simulations, showing that a topological interaction grants significantly higher cohesion of the aggregation compared with a standard metric one.


Conflict of interest statement

The authors declare no conflict of interest.

Figures

Fig. 1.
Fig. 1.
A typical analyzed flock. This group consists of 1,246 starlings, flying at ≈70 m from the cameras at ≈11 ms−1 (flock 28-10 in SI Table 1). (a and b) Left (a) and right (b) photographs of the stereo pair, taken at the same instant of time, but 25 m apart. To perform the 3D reconstruction, each bird's image on the left photo must be matched to its corresponding image on the right photo. Five matched pairs of birds are visualized by the red squares. (c–f) Three-dimensional reconstruction of the flock under four different points of view. (d) Reconstructed flock under the same perspective as in b.
Fig. 2.
Fig. 2.
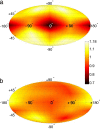
Angular density of nearest neighbors. For each bird i we define the unit vector u⃗i in the direction of its nearest neighbor. We then place all of the vectors u⃗i at the same origin and plot their density on the unitary sphere (Mollweide projection). We normalize by the isotropic case so that the density is uniformly equal to 1 for a noninteracting aggregation of individuals. The velocity V⃗ goes through the center of the map, whereas the component of gravity perpendicular to the velocity, G⃗, corresponds with a minus sign to the zenith of the map (velocity V⃗ and gravity G⃗ are approximately orthogonal in all flocks; on average, V⃗·G⃗ = 0.13 ± 0.02 SE). The plane P orthogonal to G⃗ corresponds to the horizon. The latitude, or elevation, φ ∈[−90°:90°] indicates the angle between ui and the horizon plane P. The longitude, or bearing, α ∈[−180°:180°] indicates the angle between the projection of u⃗i on the horizon plane P and the velocity V⃗. Therefore, the center of the map (φ = 0°, α = 0°) corresponds to the front of the bird, whereas the points (φ = 0°, α = +180°) and (φ = 0°, α = −180°) correspond to the rear of the bird. (a) For nearest neighbors, the density is strongly anisotropic, with a significant lack of birds along the velocity. The map is calculated by using data from flock 25-11 (see SI Table 1). However, data from all flocks show the same lack of nearest neighbors along the velocity (SI Fig. 10). (b) The density for the tenth nearest neighbor shows no statistically significant structure, and it is compatible with a set of noninteracting points.
Fig. 3.
Fig. 3.
Assessing the range of the interaction. Let u⃗i(n) be the unit vector pointing in the direction of the nth nearest neighbor of bird i. We define the matrix, Mαβ(n) = 1/N Σ ui(n) ui(n), where the sum extends over all N birds in the flock, and α,β = x,y,z. The unitary eigenvector W⃗ (n) relative to the smallest eigenvalue of M(n) coincides with the direction of minimal density of the vectors u⃗i(n), i.e., the direction of minimal crowding of the nth nearest neighbor. To measure the degree of anisotropy in the spatial distribution of the nth nearest neighbor, we use the function γ(n) = (W⃗(n)·V⃗)2, where V⃗ is the velocity. The value of γ for an isotropic, noninteracting distribution of points is 1/3. (a) The function γ(n) is plotted for two different flocks (32-06 and 25-11); error bars represent the standard error. For both flocks, the structure becomes approximately isotropic between the sixth and the seventh nearest neighbor. The topological range nc is defined as the point on the abscissa where a linear fit of γ(n) in the decreasing interval intersects the value 1/3. (b) The average distance rn of the nth neighbor is plotted against n1/3 (error bars are smaller than symbols size). The slope of these curves is proportional to the sparseness r1 of the flock. (c) Topological range nc (to the power −1/3) vs. the sparseness r1 of each flock. No significant correlation is present (Pearson's correlation test: n = 10, R2 = 0.00021, P = 0.97). (d) Metric range (in meters) rc vs. sparseness r1. A clear linear correlation is present in this case (n = 10, R2 = 0.78, P < 0.00072).
Fig. 4.
Fig. 4.
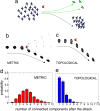
Numerical simulations in 2D: Metric vs. topological interaction under predator's attack. Each bird i is characterized by its position r⃗i and velocity V⃗i, which has constant modulus and heading θi. The dynamics is defined by: r⃗i(t + 1) = r⃗i(t) + V⃗i(t + 1) and θi(t + 1) = [θi(t) + Σj θj(t)]/(Ni + 1) (see also ref. 6). The sum runs over the Ni neighbors interacting with bird i. In the metric version of the model, one considers all neighbors within a fixed metric range rc around bird i, whereas in the topological case, the first nc neighbors are considered: Ni = nc for all i. The flock and the predator are in relative motion one against the other, with a vertical offset d. The predator exerts a repulsive force on each bird, which decays with the bird–predator distance as 1/r and gives a contribution F0 [ yi cos(θi) − xi sin(θi)]/ri2 to the equation for the heading θi. (a) Sketch of the experiment: An initially cohesive and polarized flock moves toward the predator (orange arrow) and interacts with it. (b and c) Typical flocks' trajectories. In the metric case, many birds are pushed out of the flock, whereas in the topological case, no stragglers arise. (d and e) Probability that the flock breaks into M connected components (CC) after the attack; a CC is defined as a set of birds that are within a distance 3rc from at least one other bird. In the metric, case stragglers are the 43% of the CC, whereas in the topological case, they are just the 5%. In a second simulation, flocks are sent against an obstacle. To avoid it, the velocity of each bird is randomly reassigned whenever it gets too close to the obstacle. The probability of M is very similar to the predator setup; metric stragglers are 24% of the CC; topological stragglers are 0.7%. Parameters of the simulation are as follow: n = 200 particles; T = 2,000 time steps; number of different initial conditions Nin = 5,000 (metric case) or 2,000 (topological case); rc = 0.15 (metric case); nc = 3 (topological case); vi = 0.25 s−1; d = 0.9; F0 = 0.05. Initial birds are confined in a region of size R = 1 and have aligned velocities. Boundaries are open. We checked that the results do not change qualitatively in an ample and stable range of parameters.

References

    1. Parrish JK, Edelstein-Keshet L. Complexity, pattern, and evolutionary trade-offs in animal aggregation. Science. 1999;284:99–101. - PubMed
    1. Krause J, Ruxton GD. Living in Groups. Oxford: Oxford Univ Press; 2002.
    1. Emlen JT. Flocking behaviour in birds. The Auk. 1952;69:160–170.
    1. Pitcher TJ, Parrish JK. Behaviour of Teleost Fishes. In: Pitcher TJ, editor. London: Chapman and Hall; 1993.
    1. Gueron S, Levin SA, Rubenstein DI. The dynamics of herds: From individuals to aggregations. J Theor Biol. 1996;182:85–98.

Publication types