. 2007 Winter;12(4):299-306.
doi: 10.1379/csc-270.1.

Oxidative stress and cellular stress response in diabetic nephropathy

Affiliations

Oxidative stress and cellular stress response in diabetic nephropathy

Vittorio Calabrese et al. Cell Stress Chaperones. 2007 Winter.

Abstract

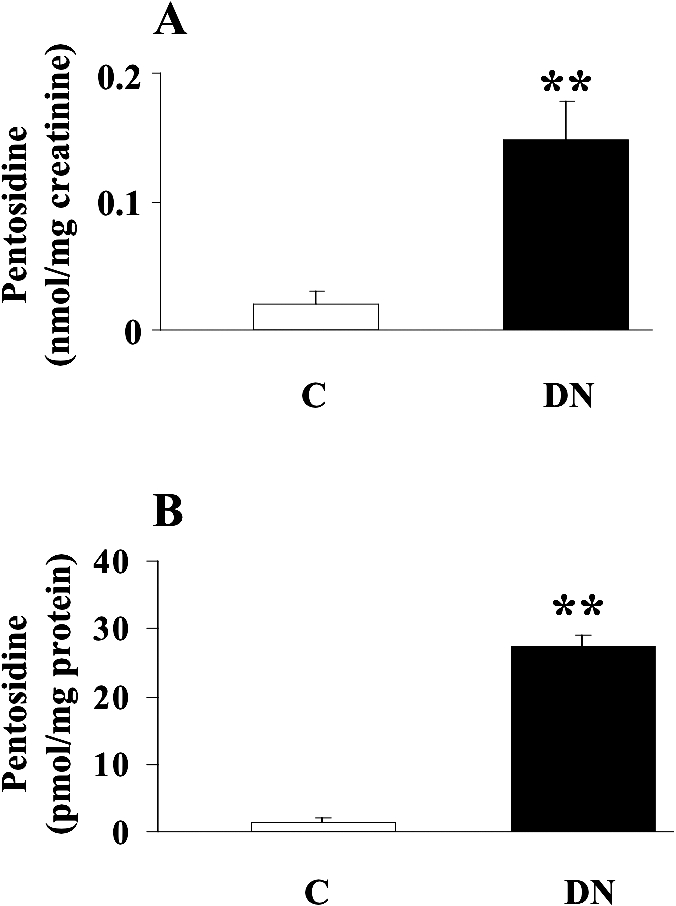
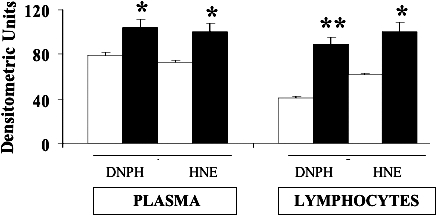
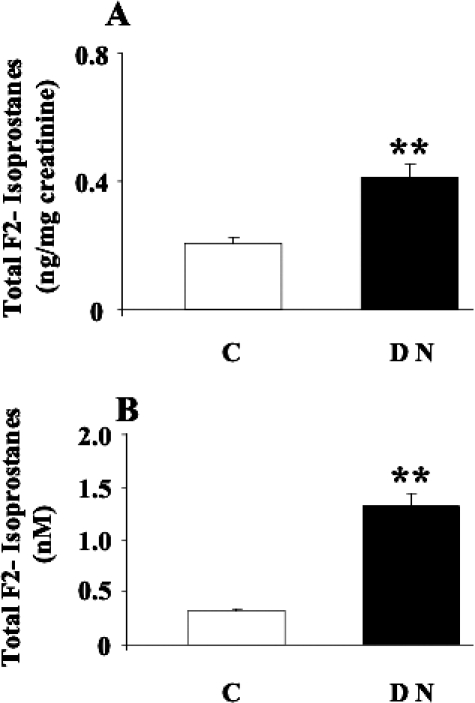
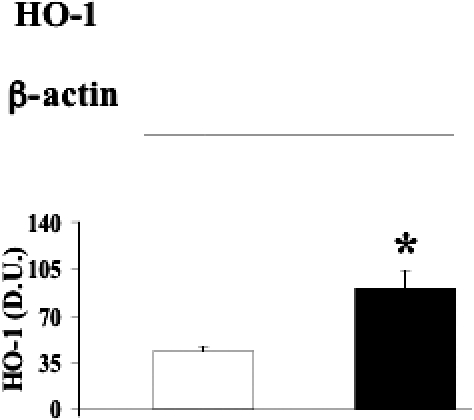
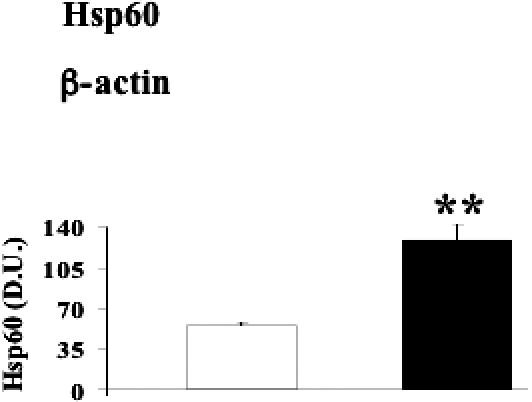
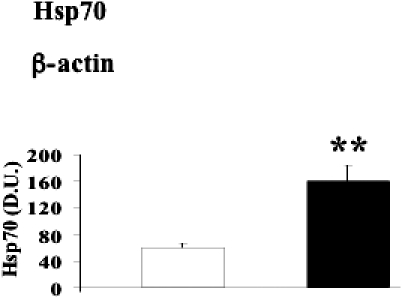
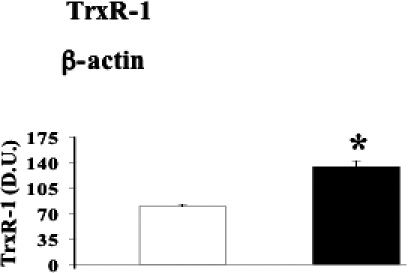
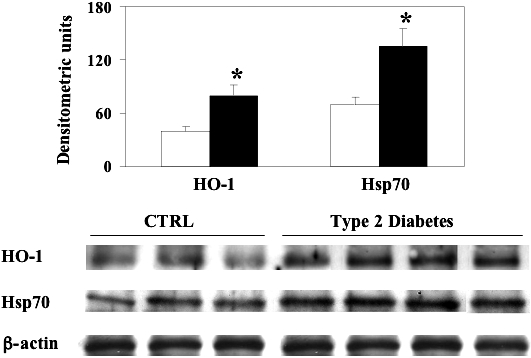
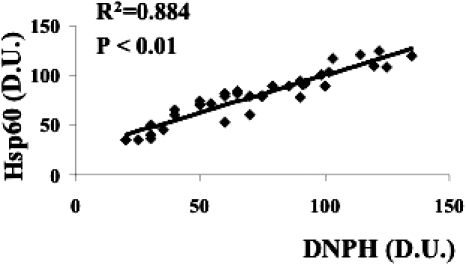
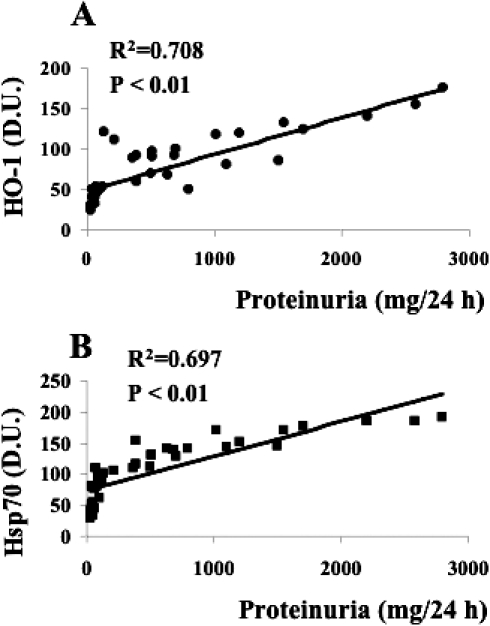
Oxidative stress has been suggested to play a main role in the pathogenesis of type 2 diabetes mellitus and its complications. As a consequence of this increased oxidative status, a cellular-adaptive response occurs requiring functional chaperones, antioxidant production, and protein degradation. This study was designed to evaluate systemic oxidative stress and cellular stress response in patients suffering from type 2 diabetes-induced nephropathy and in age-matched healthy subjects. Systemic oxidative stress has been evaluated by measuring advanced glycation end-products (pentosidine), protein oxidation (protein carbonyls [DNPH]), and lipid oxidation (4-hydroxy-2-nonenal [HNE] and F2-isoprostanes) in plasma, lymphocytes, and urine, whereas the lymphocyte levels of the heat shock proteins (Hsps) heme oxygenase-1 (HO-1), Hsp70, and Hsp60 as well as thioredoxin reductase-1 (TrxR-1) have been measured to evaluate the systemic cellular stress response. We found increased levels of pentosidine (P < 0.01), DNPH (P < 0.05 and P < 0.01), HNE (P < 0.05 and P < 0.01), and F2-isoprostanes (P < 0.01) in all the samples from type 2 diabetic patients with nephropathy with respect to control group. This was paralleled by a significant induction of cellular HO-1, Hsp60, Hsp70, and TrxR-1 (P < 0.05 and P < 0.01). A significant upregulation of both HO-1 and Hsp70 has been detected also in lymphocytes from type 2 diabetic patients without uraemia. Significant positive correlations between DNPH and Hsp60, as well as between the degree of renal failure and HO-1 or Hsp70, also have been found in diabetic uremic subjects. In conclusion, patients affected by type 2 diabetes complicated with nephropathy are under condition of systemic oxidative stress, and the induction of Hsp and TrxR-1 is a maintained response in counteracting the intracellular pro-oxidant status.


Figures

Fig 1.
Fig 1.
Pentosidine levels in urine and plasma from diabetic patients. (A) Urine and (B) plasma samples from patients with nephropathy secondary to type 2 diabetes and age-matched controls were assayed for pentosidine by high-performance liquid chromatography, as described in Materials and Methods. Data are expressed as mean ± standard error of mean of 3 independent analyses on 16– 21 patients per group. **P < 0.01 vs controls; C, controls; DN, type 2 diabetic patients with nephropathy
Fig 2.
Fig 2.
Protein carbonyls and 4-hydroxy-2-nonenals levels in plasma and lymphocytes from diabetic patients. Plasma and lymphocytes samples from type 2 diabetic patients with nephropathy (black columns) and age-matched controls (white columns) were assayed for protein carbonyls (DNPH) and 4-hydroxy-2-nonenals (HNE) by Western blot, as described in Materials and Methods. Values are expressed as mean ± standard error of mean of 3 independent analyses on 16–21 patients per group. *P < 0.05 and **P < 0.01 vs controls
Fig 3.
Fig 3.
Total F2-isoprostanes levels in urine and plasma from diabetic patients. (A) Urine and (B) plasma samples from patients with nephropathy secondary to type 2 diabetes and age-matched controls were assayed for F2-isoprostanes by high-performance liquid chromatography as described in Materials and Methods. Data are expressed as mean ± standard error of mean of 3 independent analyses on 16–21 patients per group. **P < 0.01 vs controls; C, controls; DN, type 2 diabetic patients with nephropathy
Fig 4.
Fig 4.
Heme oxygenase-1 levels in lymphocytes from diabetic nephropathic patients. Lymphocyte samples from patients with nephropathy secondary to type 2 diabetes (black columns) and age-matched controls (white columns) were assayed for heme oxygenase-1 (HO-1) by Western blot as described in Materials and Methods. A representative immunoblot is shown. β-actin has been used as loading control. The bar graph shows the densitometric evaluation and values are expressed as mean ± standard error of mean of 3 independent analyses on 16–21 patients per group. *P < 0.05 vs control; D.U., densitometric units
Fig 5.
Fig 5.
Heat shock protein 60 (Hsp60) levels in lymphocytes from diabetic nephropathic patients. Lymphocyte samples from patients with nephropathy secondary to type 2 diabetes (black columns) and age-matched controls (white columns) were assayed for Hsp60 by Western blot as described in Materials and Methods. A representative immunoblot is shown. β-actin has been used as loading control. The bar graph shows the densitometric evaluation and values are expressed as mean ± standard error of mean of 3 independent analyses on 16–21 patients per group. **P < 0.01 vs control; D.U., densitometric units.
Fig 6.
Fig 6.
Heat shock protein 70 (Hsp70) levels in lymphocytes from diabetic nephropathic patients. Lymphocyte samples from patients with nephropathy secondary to type 2 diabetes (black columns) and age-matched controls (white columns) were assayed for Hsp70 by Western blot as described in Materials and Methods. A representative immunoblot is shown. β-actin has been used as loading control. The bar graph shows the densitometric evaluation and values are expressed as mean ± standard error of mean of 3 independent analyses on 16–21 patients per group. **P < 0.01 vs control; D.U., densitometric units.
Fig 7.
Fig 7.
Thioredoxin reductase-1 levels in lymphocytes from diabetic nephropathic patients. Lymphocyte samples from patients with nephropathy secondary to type 2 diabetes (black columns) and age-matched controls (white columns) were assayed for thioredoxin reductase-1 (TrxR-1) by Western blot as described in Materials and Methods. A representative immunoblot is shown. β-actin has been used as loading control. The bar graphs show the densitometric evaluation and values are expressed as mean ± standard error of mean of 3 independent analyses on 16–21 patients per group. *P < 0.05 vs control; D.U., densitometric units
Fig 8.
Fig 8.
Heme oxygenase-1 and heat shock protein 70 (Hsp70) levels in lymphocytes from type 2 diabetic patients without nephropathy. Lymphocyte samples from patients with type 2 diabetes (dashed columns) and age-matched controls (white columns) were assayed for heme oxygenase-1 (HO-1) and Hsp70 by Western blot as described in Materials and Methods. A representative immunoblot containing samples from 3 control subjects and 4 patients with type 2 diabetes is shown. β-actin has been used as loading control. The bar graphs show the densitometric evaluation; values are expressed as mean ± standard error of mean of 3 independent analyses on 10–21 patients per group. P < 0.05 vs control; CTRL, control
Fig 9.
Fig 9.
Relationship between protein carbonyls and heat shock protein 60 (Hsp60) in lymphocytes from diabetic nephropathic patients. Lymphocyte samples from 21 patients with nephropathy secondary to type 2 diabetes and 16 age-matched controls were assayed for both protein carbonyls (DNPH) and Hsp60 as described in Figures 2 and 5, respectively. A significant linear positive correlation has been found. Data are expressed as densitometric units (D.U.). Control subjects had a DNPH level ranging from 20 to 70 D.U
Fig 10.
Fig 10.
Relationship between the degree of renal failure and the lymphocyte heat shock response in diabetic nephropathic patients. Lymphocyte samples from 21 patients with nephropathy secondary to type 2 diabetes and 16 age-matched controls were assayed for heme oxygenase-1 (HO-1, panel A) and heat shock protein70 (Hsp70, panel B) as described in Figures 4 and 6, respectively. Heme oxygenase-1 and Hsp70 levels then were plotted against the 24-h proteinuria values of each subject. Proteinuria is a reliable clinical index of renal failure. Significant linear positive correlations have been found. Heme oxygenase-1 and Hsp70 levels are expressed as densitometric units (D.U.), whereas urinary protein is in mg/24 h. Control subjects had urinary proteins ranging from 30 to 120 mg/24 h

References

    1. Basu S. Isoprostanes: novel bioactive products of lipid peroxidation. Free Radic Res. 2004;38:105–122.1071-5762(2004)038[0105:INBPOL]2.0.CO;2 - PubMed
    1. Beisswenger PJ, Drummond KS, Nelson RG, Howell SK, Szwergold BS, Mauer M. Susceptibility to diabetic nephropathy is related to dicarbonyl and oxidative stress. Diabetes. 2005;54:3274–3281.0012-1797(2005)054[3274:STDNIR]2.0.CO;2 - PubMed
    1. Bierhaus A, Hofmann MA, Ziegler R, Nawroth PP. AGEs and their interaction with AGE-receptors in vascular disease and diabetes mellitus I. The AGE concept. Cardiovasc Res. 1998;37:586–600.0008-6363(1998)037[0586:AATIWA]2.0.CO;2 - PubMed
    1. Bonnefont-Rousselot D, Bastard JP, Jaudon MC, Delattre J. Consequences of the diabetic status on the oxidant/antioxidant balance. Diabetes Metab. 2000;26:163–176.0338-1684(2000)026[0163:COTDSO]2.0.CO;2 - PubMed
    1. Bruce CR, Carey AL, Hawley JA, Febbraio MA. Intramuscular heat shock protein 72 and heme oxygenase-1 mRNA are reduced in patients with type 2 diabetes: evidence that insulin resistance is associated with a disturbed antioxidant defense mechanism. Diabetes. 2003;52:2338–2345.0012-1797(2003)052[2338:IHSPAH]2.0.CO;2 - PubMed

Publication types

MeSH terms