. 2008 Feb 5;105(5):1410-5.
doi: 10.1073/pnas.0707654105. Epub 2008 Jan 29.

Circulation and long-term fate of functionalized, biocompatible single-walled carbon nanotubes in mice probed by Raman spectroscopy

Affiliations

Circulation and long-term fate of functionalized, biocompatible single-walled carbon nanotubes in mice probed by Raman spectroscopy

Zhuang Liu et al. Proc Natl Acad Sci U S A. .

Abstract

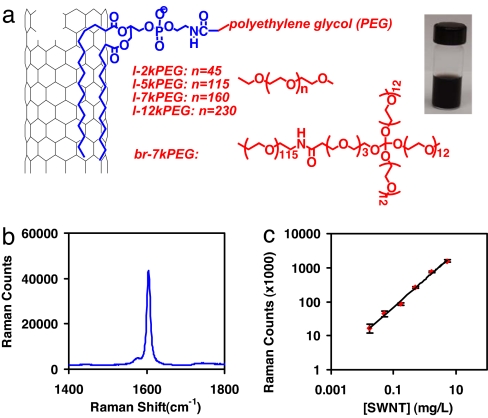
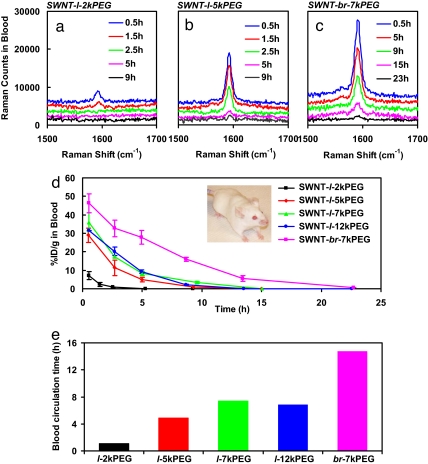
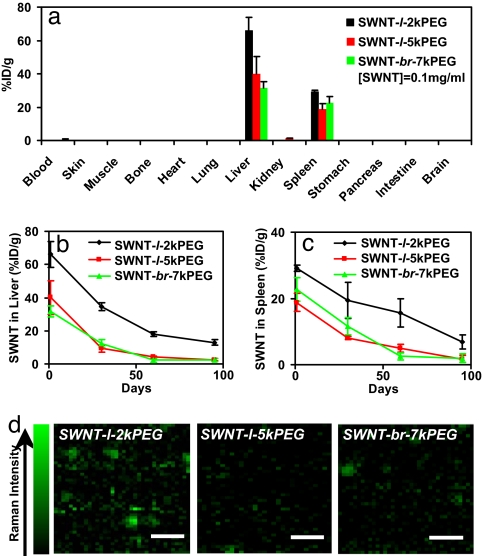
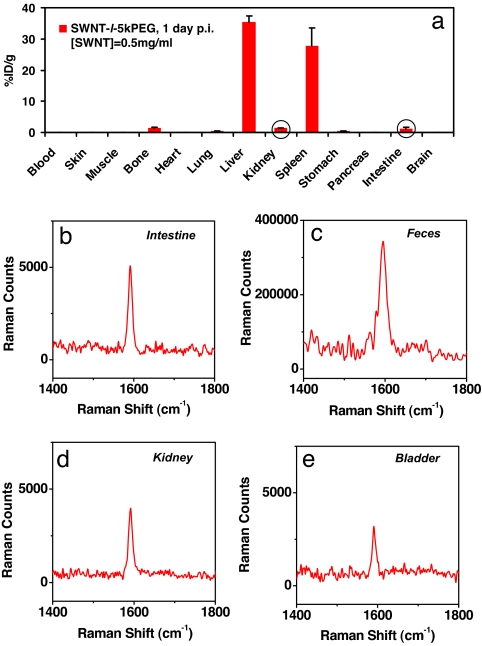
Carbon nanotubes are promising new materials for molecular delivery in biological systems. The long-term fate of nanotubes intravenously injected into animals in vivo is currently unknown, an issue critical to potential clinical applications of these materials. Here, using the intrinsic Raman spectroscopic signatures of single-walled carbon nanotubes (SWNTs), we measured the blood circulation of intravenously injected SWNTs and detect SWNTs in various organs and tissues of mice ex vivo over a period of three months. Functionalization of SWNTs by branched polyethylene-glycol (PEG) chains was developed, enabling thus far the longest SWNT blood circulation up to 1 day, relatively low uptake in the reticuloendothelial system (RES), and near-complete clearance from the main organs in approximately 2 months. Raman spectroscopy detected SWNT in the intestine, feces, kidney, and bladder of mice, suggesting excretion and clearance of SWNTs from mice via the biliary and renal pathways. No toxic side effect of SWNTs to mice was observed in necropsy, histology, and blood chemistry measurements. These findings pave the way to future biomedical applications of carbon nanotubes.


Conflict of interest statement

The authors declare no conflict of interest.

Figures

Fig. 1.
Fig. 1.
Noncovalently functionalized SWNTs by various PEGylated phospholipids. (a Left) Scheme of functionalization by various phospholipid-PEGs with linear or branched PEG chains. (Right) A photo of the SWNT-br-7kPEG saline solution at the concentration (0.1 mg/ml; optical density was 4.6 at 808 nm for 1 cm path) used for injection. (b) A Raman spectrum of a solution of SWNT-l-2kPEG. The G band peak at 1,590 cm−1 was used for SWNT detection in this work. (c) Raman intensity vs. SWNT concentration calibration curve. Linear dependence was observed from 0.02 μg/ml to 4 μg/ml.
Fig. 2.
Fig. 2.
Blood circulation behavior of SWNTs probed by Raman spectroscopy. (a–c) Raman spectra of blood samples drawn from BALB/c mice at various time points after injection with SWNT-l-2kPEG (a) SWNT-l-5kPEG (b), and SWNT-br-7kPEG (c) solutions, respectively. Note that spectrum baselines were subtracted in a–c. (d) Blood circulation data probed by the Raman method for SWNT-l-2kPEG, SWNT-l-5kPEG, SWNT-l-7kPEG, SWNT-l-12kPEG, and SWNT-br-7kPEG. Injected into BALB/c mice (Inset). The SWNT levels in blood were determined as percentage of injected SWNT amount per gram of blood (%ID/g in blood). SWNT-l-5kPEG, SWNT-l-7kPEG, and SWNT-l-12kPEG showed similar blood circulation time, significantly longer than that of SWNT-l-2kPEG. The longest blood circulation was observed for SWNT-br-7kPEG. The error bars are based on four mice in each group. (e) Blood circulation time of SWNTs with different PEGylations. The blood circulation time was defined as the time duration through which the blood SWNT level reduced to 5%ID/g.
Fig. 3.
Fig. 3.
SWNTs in mice tissues probed by ex vivo Raman spectroscopy after injection into mice. (a) Biodistribution of SWNT-l-2kPEG, SWNT-l-5kPEG, and SWNT-br-7kPEG, respectively, at 1 day p.i. measured by Raman spectroscopy. The SWNT concentrations in most organs are below detection limit. (b and c) Evolution of the concentrations of SWNTs retained in the liver and spleen of mice over a period of 3 months. Compared with SWNT-l-2kPEG, much lower concentrations of retained SWNTs in the liver and spleen were observed for SWNT-l-5kPEG and SWNT-br-7kPEG. (d) Raman mapping images of liver slices from mice treated with SWNT-l-2kPEG (Left), SWNT-l-5kPEG (Center), and SWNT-br-7kEG (Right)at 3 months p.i. More SWNT signals were observed in the SWNT-l-2kPEG-treated mouse sample than the other two samples under the same Raman imaging conditions (laser power, beam size, etc.). The error bars in a–c were based on three to four mice per group. Note that the injected SWNT solutions had a concentration of 0.1 mg/ml (optical density was 4.6 at 808 nm for 1 cm path).
Fig. 4.
Fig. 4.
Biodistribution measured under ultra-high dose SWNT (0.5 mg/ml) injection. (a) Biodistribution of SWNT-l-5kPEG in various organs of mice received 200 μl of 0.5 mg/ml SWNT-l-5kPEG at 24 h p.i. After increasing of the injected dose, SWNTs became detectable by Raman in several organs including bone, lung, kidney, stomach, and intestine, with slightly over 1%ID/g in bone, kidney and intestine. Error bars were based on three mice. (b and c) Raman spectra of intestine lysate at 24 h p.i. (b) and dry feces sample collected 8 h p.i. (c). Because of high background in the feces sample, the spectrum was taken by 600 s long time collection (5 s for all of the other samples). An appreciable amount of nanotubes was noticed in the intestine and feces, providing clear evidence for the biliary excretion pathway of intravenously injected SWNTs. (d and e) Raman spectra of kidney (d) and bladder (e) lysates from mice at 24 h p.i. The existence of SWNTs in the kidney and bladder indicate that a small portion of nanotubes is excreted via the kidney-urine pathway. Note that background has been subtracted in the spectra b–e.

References

    1. Whitesides GM. The “right” size in nanobiotechnology. Nat Biotech. 2003;21:1161–1165. - PubMed
    1. Service RF. Nanotechnology takes aim at cancer. Science. 2005;310:1132–1134. - PubMed
    1. Sinha R, Kim GJ, Nie SM, Shin DM. Nanotechnology in cancer therapeutics: Bioconjugated nanoparticles for drug delivery. Mol Cancer Ther. 2006;5:1909–1917. - PubMed
    1. Gao XH, Cui YY, Levenson RM, Chung LWK, Nie SM. In vivo cancer targeting and imaging with semiconductor quantum dots. Nat Biotech. 2004;22:969–976. - PubMed
    1. Farokhzad OC, et al. Targeted nanoparticle-aptamer bioconjugates for cancer chemotherapy in vivo. Proc Natl Acad Sci USA. 2006;103:6315–6320. - PMC - PubMed

Publication types