. 2008 Mar;18(3):449-61.
doi: 10.1101/gr.6943508. Epub 2008 Jan 29.

Evolution of protein domain promiscuity in eukaryotes

Affiliations

Evolution of protein domain promiscuity in eukaryotes

Malay Kumar Basu et al. Genome Res. 2008 Mar.

Abstract

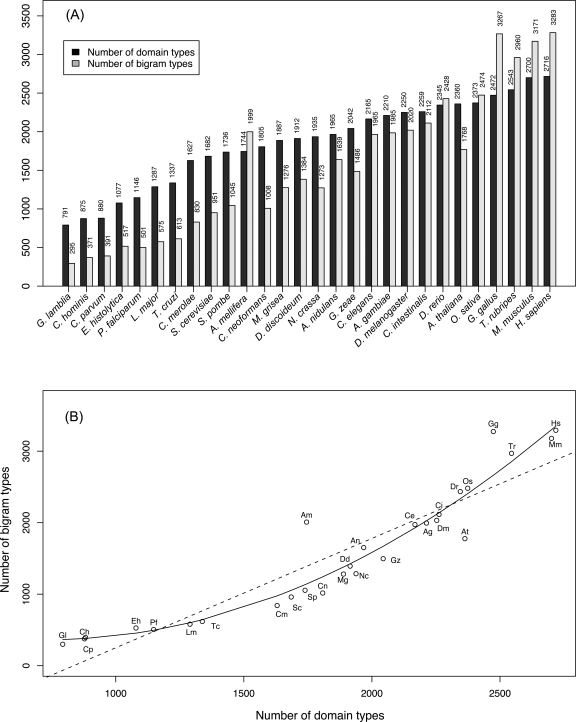
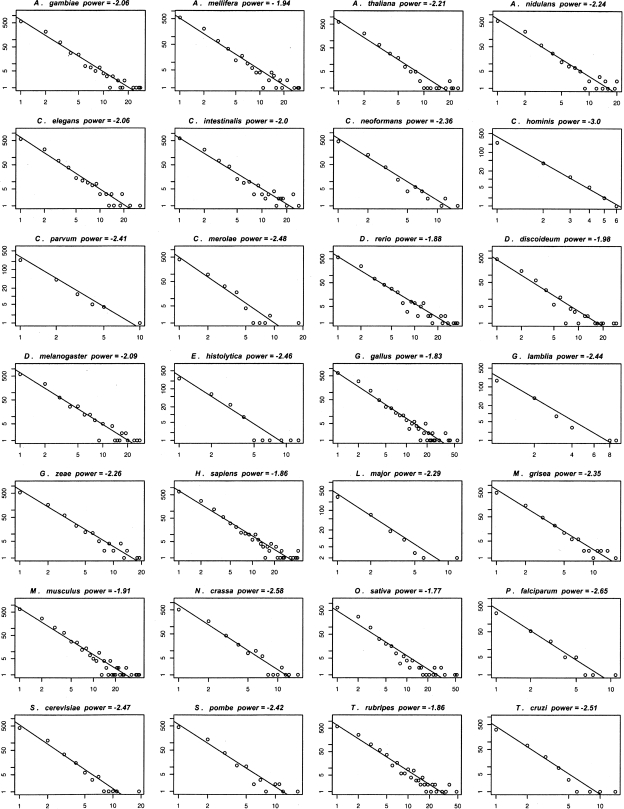
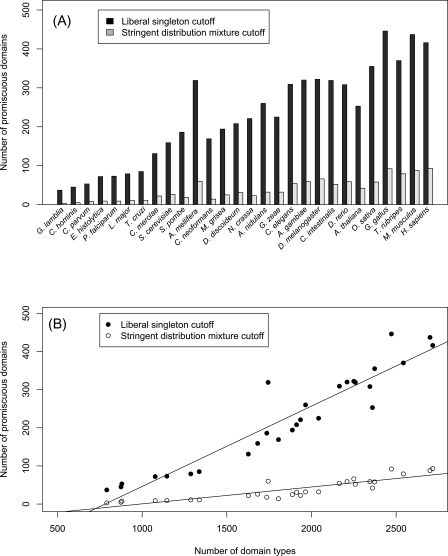
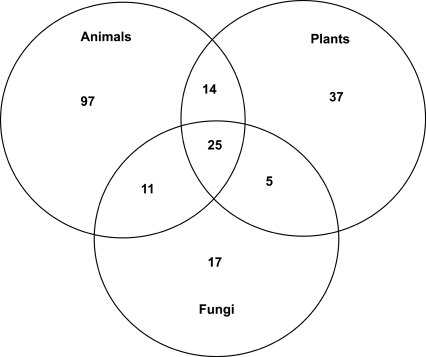
Numerous eukaryotic proteins contain multiple domains. Certain domains show a tendency to occur in diverse domain architectures and can be considered "promiscuous." These promiscuous domains are, typically, involved in protein-protein interactions and play crucial roles in interaction networks, particularly those that contribute to signal transduction. A systematic comparative-genomic analysis of promiscuous domains in eukaryotes is described. Two quantitative measures of domain promiscuity are introduced and applied to the analysis of 28 genomes of diverse eukaryotes. Altogether, 215 domains are identified as strongly promiscuous. The fraction of promiscuous domains in animals is shown to be significantly greater than that in fungi or plants. Evolutionary reconstructions indicate that domain promiscuity is a volatile, relatively fast-changing feature of eukaryotic proteins, with few domains remaining promiscuous throughout the evolution of eukaryotes. Some domains appear to have attained promiscuity independently in different lineages, for example, animals and plants. It is proposed that promiscuous domains persist within a relatively small pool of evolutionarily stable domain combinations from which numerous rare architectures emerge during evolution. Domain promiscuity positively correlates with the number of experimentally detected domain interactions and with the strength of purifying selection affecting a domain. Thus, evolution of promiscuous domains seems to be constrained by the diversity of their interaction partners. The set of promiscuous domains is enriched for domains mediating protein-protein interactions that are involved in various forms of signal transduction, especially in the ubiquitin system and in chromatin. Thus, a limited repertoire of promiscuous domains makes a major contribution to the diversity and evolvability of eukaryotic proteomes and signaling networks.


Figures

Figure 1.
Figure 1.
(A) The counts of distinct domain types and distinct bigram types in the analyzed species. (B) The dependence of the number of bigrams types on the number of domain types encoded in a genome. The linear (dotted) and quadratic (solid) regression lines are shown. The quadratic function is a better fit than the linear function (Pearson’s product-moment correlation: 0.92; P-value ∼ 0.005). Each point is labeled with the species abbreviations as described in Methods.
Figure 2.
Figure 2.
Power law distributions of bigram frequencies in 28 eukaryotes. The linear regression is shown on each plot. Each panel shows log-log plots of the count of bigram types on the X-axis and the domain count (number of domains participating in that many bigram types as X coordinate) on the Y-axis. The species name and the power of the regression line are shown at the top of each plot.
Figure 3.
Figure 3.
Distribution of promiscuous domains in eukaryotes. (A) Promiscuous domains in the analyzed eukaryotic species. (Black bars) Promiscuous domains defined using weighted bigram frequency with the cutoff determined by the liberal singleton method; (gray bars) promiscuous domains defined using the strict distribution mixture criterion (see text for details). (B) The number of promiscuous domains (on the Y-axis) increases with the number of unique domain types (on the X-axis). (Black circles) Promiscuous domains determined by the liberal singleton cutoff method (Pearson’s correlation 0.94, P-value 4.4 × 10⁻¹⁴); (empty circles) promiscuous domains determined with the strict distribution mixture criterion (Pearson’s correlation 0.88, P-value 4.6 × 10⁻¹⁰).
Figure 4.
Figure 4.
Distribution of promiscuous domains in animals, plants, and fungi. The overlap exceeds the random expectation with a P-value of 9.9 × 10−52 with the background probability calculated using the Monte-Carlo method).
Figure 5.
Figure 5.
A tree of eukaryotes derived using the correlation values from the ordered list of promiscuity for domains in each of the analyzed species. The tree is color-coded according to the major groups of eukaryotes as follows: (orange) Animals; (green) Plantae; (dark blue) Fungi; (light blue) Kinetoplastida; (magenta) Apicomplexa; (gray) Diplomonada.
Figure 6.
Figure 6.
Gain and loss of domains and domain promiscuity during the evolution of eukaryotes. The number of domains gained and lost in each branch, inferred using Dollo parsimony, is shown on the bar plot to the left of the branch, and the number of gained and lost promiscuous domains, inferred using DNAPARS, is shown on the bar plot to the right of the branch. (Green bars) gain; (red bars) loss. The bars are normalized to the highest gain (green bars) or highest loss (red bars) of all the nodes. Additionally, each edge is colored to indicate (green) the greater number of gained promiscuous domains, (red) the greater number of lost promiscuous domains, and (black) equal contributions of gain and loss of promiscuity. The root node represents the Last Eukaryotic Common Ancestor (LECA). As gain and loss cannot be inferred for LECA, the presence of domains and the number of domains ascertained to be promiscuous are given by numbers. The major branches of eukaryotes are labeled. The tree has the “crown group” topology (Hedges 2002). For additional information, see Supplemental Figure S2. The species abbreviations are as described in Methods.
Figure 7.
Figure 7.
Distribution of bigram frequency in the analyzed genomes for all promiscuous domains. The bigram occurrence data were separated into 10 bins (bin 1, bigrams found in 0%–10% genomes; bin 2, bigrams found in 11%–20% genomes; . . .; bin 10, bigrams found in 91%–100% genomes).
Figure 8.
Figure 8.
Gain and loss of domain bigrams during the evolution of eukaryotes. The parsimonious scenario of gains and losses was reconstructed using the DNAPARS program for the “crown group” topology of the eukaryotic phylogenetic tree. (Bar plots) The number of bigrams (green) gained and (red) lost in each branch. The other designations are as in Figure 6. For additional information, see Supplemental Figure S4.
Figure 9.
Figure 9.
Distribution of promiscuous domains among functional categories of eukaryotic proteins. The categories are indicated with single-letter abbreviations on the X-axis, and the exact count of promiscuous domains in that category is shown on the top of each bar. If a domain is classified in more than one category, it is counted more than once. Abbreviations for functional categories (Tatusov et al. 2003) on the X-axis are: (A) RNA processing and modification; (B) chromatin structure and dynamics; (C) energy production and conversion; (D) cell cycle control, cell division, chromosome partitioning; (E) amino acid transport and metabolism; (F) nucleotide transport and metabolism; (G) carbohydrate transport and metabolism; (H) coenzyme transport and metabolism; (I) lipid transport and metabolism; (J) translation, ribosomal structure and biogenesis; (K) transcription; (L) replication, recombination, and repair; (N) cell motility; (O) post-translational modification, protein turnover, chaperones; (P) inorganic ion transport and metabolism; (Q) secondary metabolites biosynthesis, transport, and catabolism; (T) signal transduction; (U) intracellular trafficking, secretion, and vesicular transport; (W) extracellular structures and cell–cell signaling; (Y) nuclear structure; (Z) cytoskeleton; (**) various functions; (?) unknown function.

References

    1. Anantharaman V., Koonin E.V., Aravind L., Koonin E.V., Aravind L., Aravind L. Regulatory potential, phyletic distribution and evolution of ancient, intracellular small-molecule-binding domains. J. Mol. Biol. 2001;307:1271–1292. - PubMed
    1. Apic G., Gough J., Teichmann S.A., Gough J., Teichmann S.A., Teichmann S.A. Domain combinations in archaeal, eubacterial and eukaryotic proteomes. J. Mol. Biol. 2001;310:311–325. - PubMed
    1. Aravind L., Dixit V.M., Koonin E.V., Dixit V.M., Koonin E.V., Koonin E.V. Apoptotic molecular machinery: Vastly increased complexity in vertebrates revealed by genome comparisons. Science. 2001;291:1279–1284. - PubMed
    1. Bashton M., Chothia C., Chothia C. The generation of new protein functions by the combination of domains. Structure. 2007;15:85–99. - PubMed
    1. Bohning D., Schlattmann P., Lindsay B., Schlattmann P., Lindsay B., Lindsay B. Computer-assisted analysis of mixtures (C.A.MAM): Statistical algorithms. Biometrics. 1992;48:283–303. - PubMed

Publication types

LinkOut - more resources