

Gene expression profiling identifies lobe-specific and common disruptions of multiple gene networks in testosterone-supported, 17beta-estradiol- or diethylstilbestrol-induced prostate dysplasia in Noble rats
- PMID: 18231636
- PMCID: PMC2216049
- DOI: 10.1593/neo.07889
Gene expression profiling identifies lobe-specific and common disruptions of multiple gene networks in testosterone-supported, 17beta-estradiol- or diethylstilbestrol-induced prostate dysplasia in Noble rats
Abstract
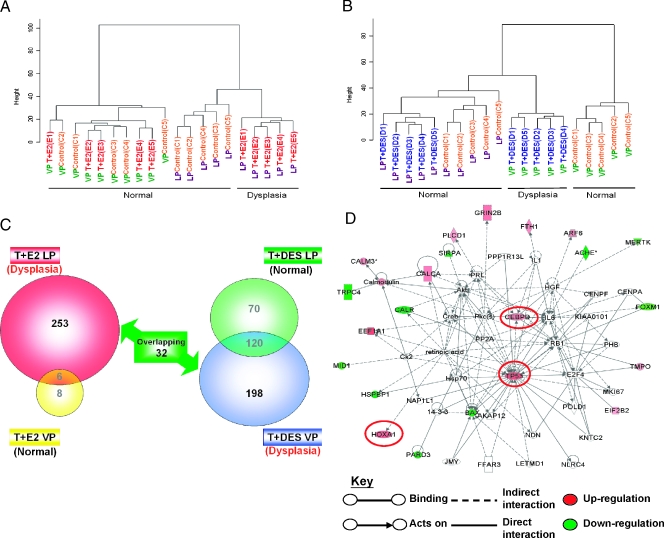
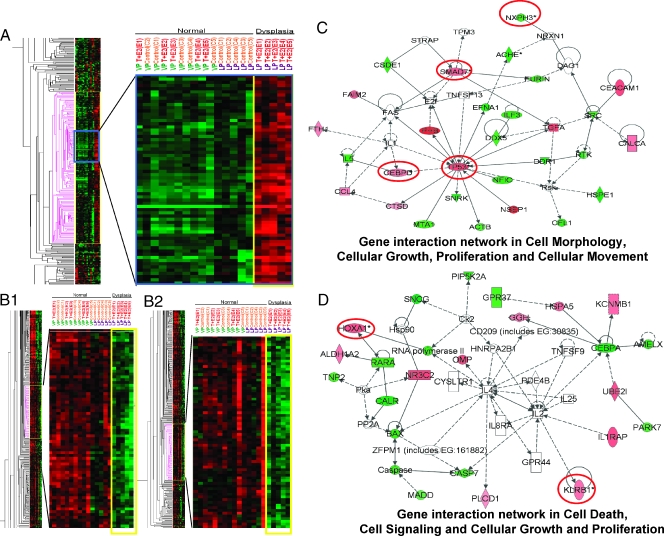
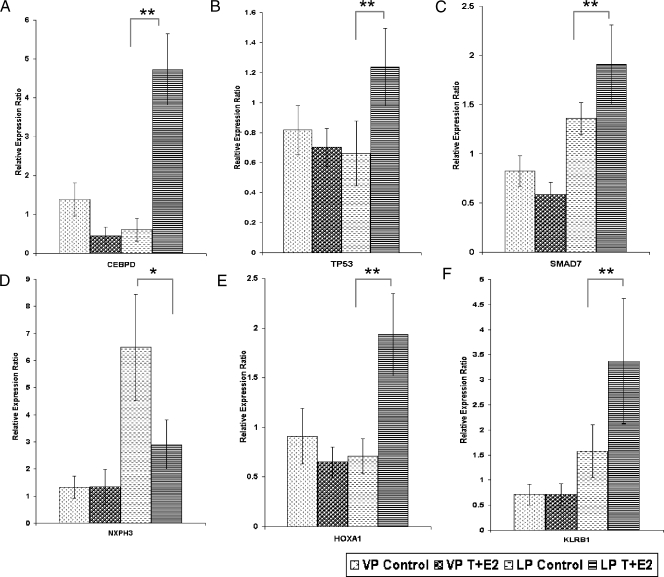
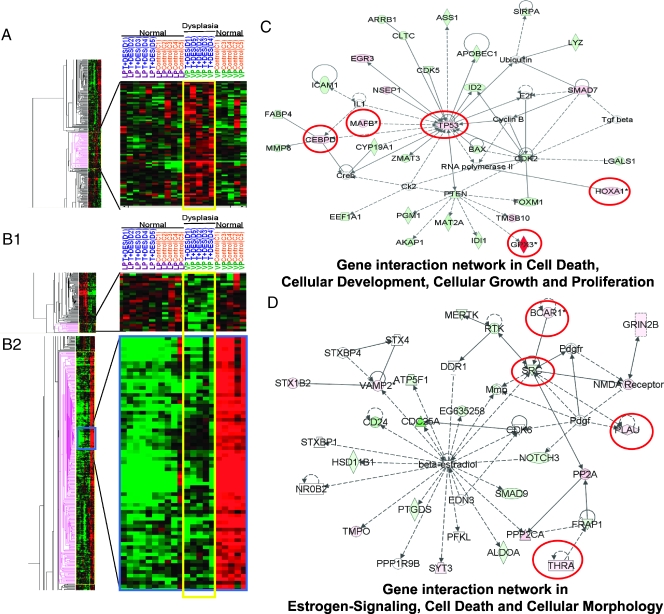
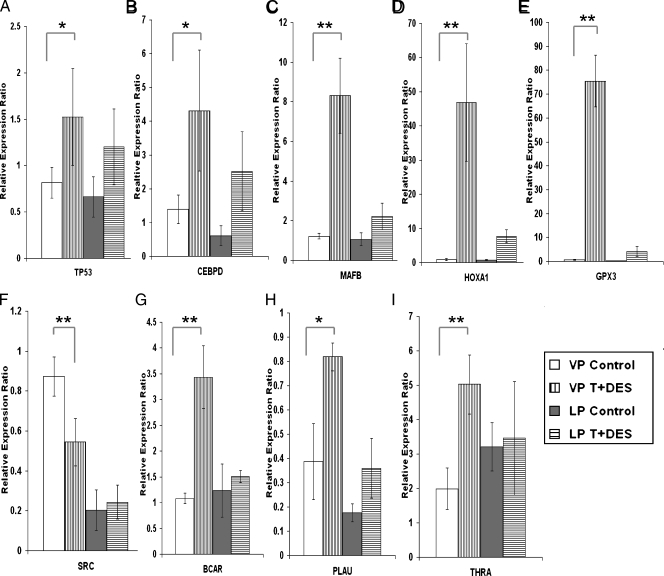
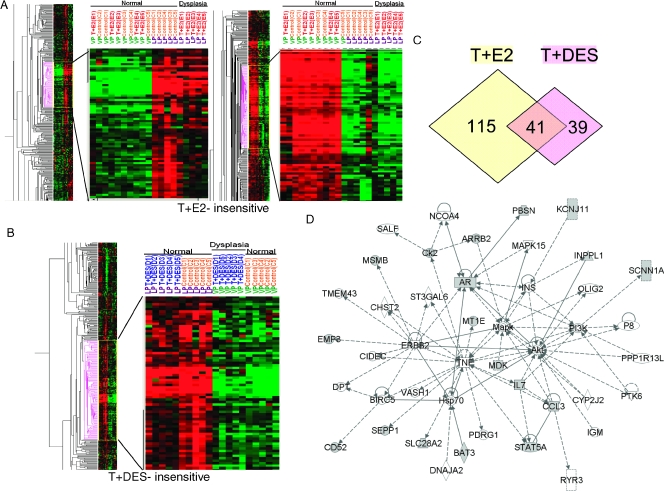
The xenoestrogen diethylstilbestrol (DES) is commonly believed to mimic the action of the natural estrogen 17beta-estradiol (E2). To determine if these two estrogens exert similar actions in prostate carcinogenesis, we elevated circulating levels of estrogen in Noble (NBL) rats with E(2/DES-filled implants, while maintaining physiological levels of testosterone (T) in the animals with T-filled implants. The two estrogens induced dysplasia in a lobe-specific manner, with E2 targeting only the lateral prostate (LP) and DES impacting only the ventral prostate (VP). Gene expression profiling identified distinct and common E2-disrupted versus DES-disrupted gene networks in each lobe. More importantly, hierarchical clustering analyses revealed that T + E2 treatment primarily affected the gene expression pattern in the LP, whereas T + DES treatment primarily affected the gene expression profile in the VP. Gene ontology analyses and pathway mapping suggest that the two hormone treatments disrupt unique and/or common cellular processes, including cell development, proliferation, motility, apoptosis, and estrogen signaling, which may be linked to dysplasia development in the rat prostate. These findings suggest that the effects of xenoestrogens and natural estrogens on the rat prostate are more divergent than previously suspected and that these differences may explain the lobe-specific carcinogenic actions of the hormones.
Figures
Similar articles
-
Sex hormone-induced alterations in the activities of antioxidant enzymes and lipid peroxidation status in the prostate of Noble rats.Prostate. 2003 Apr 1;55(1):1-8. doi: 10.1002/pros.10169. Prostate. 2003. PMID: 12640655
-
Differential effects of diethylstilbestrol and estradiol-17 beta in combination with testosterone on rat prostate lobes.Toxicol Appl Pharmacol. 1992 Feb;112(2):300-9. doi: 10.1016/0041-008x(92)90200-c. Toxicol Appl Pharmacol. 1992. PMID: 1539166
-
Selective increase in type II estrogen-binding sites in the dysplastic dorsolateral prostates of noble rats.Cancer Res. 1993 Feb 1;53(3):528-32. Cancer Res. 1993. PMID: 7678774
-
Research resource: estrogen-driven prolactin-mediated gene-expression networks in hormone-induced prostatic intraepithelial neoplasia.Mol Endocrinol. 2010 Nov;24(11):2207-17. doi: 10.1210/me.2010-0179. Epub 2010 Sep 22. Mol Endocrinol. 2010. PMID: 20861223 Free PMC article.
-
Induction of atypical hyperplasia, apoptosis, and type II estrogen-binding sites in the ventral prostates of Noble rats treated with testosterone and pharmacologic doses of estradiol-17 beta.Lab Invest. 1995 Sep;73(3):356-65. Lab Invest. 1995. PMID: 7564268
Cited by
-
Integrated analysis of gene expression, CpG island methylation, and gene copy number in breast cancer cells by deep sequencing.PLoS One. 2011 Feb 25;6(2):e17490. doi: 10.1371/journal.pone.0017490. PLoS One. 2011. PMID: 21364760 Free PMC article.
-
Bisphenol A Disrupts HNF4α-Regulated Gene Networks Linking to Prostate Preneoplasia and Immune Disruption in Noble Rats.Endocrinology. 2016 Jan;157(1):207-19. doi: 10.1210/en.2015-1363. Epub 2015 Oct 23. Endocrinology. 2016. PMID: 26496021 Free PMC article.
-
Transcriptome analyses in normal prostate epithelial cells exposed to low-dose cadmium: oncogenic and immunomodulations involving the action of tumor necrosis factor.Environ Health Perspect. 2008 Jun;116(6):769-76. doi: 10.1289/ehp.11215. Environ Health Perspect. 2008. PMID: 18560533 Free PMC article.
-
High butter-fat diet and bisphenol A additively impair male rat spermatogenesis.Reprod Toxicol. 2017 Mar;68:191-199. doi: 10.1016/j.reprotox.2016.09.008. Epub 2016 Sep 19. Reprod Toxicol. 2017. PMID: 27658648 Free PMC article.
-
Neoplasia: the second decade.Neoplasia. 2008 Dec;10(12):1314-24. doi: 10.1593/neo.81372. Neoplasia. 2008. PMID: 19048110 Free PMC article.
References
-
- Taplin ME, Ho SM. Clinical review 134: the endocrinology of prostate cancer. J Clin Endocrinol Metab. 2001;86:3467–3477. - PubMed
-
- Ho SM, Leung YK, Chung I. Estrogens and antiestrogens as etiological factors and therapeutics for prostate cancer. Ann NY Acad Sci. 2006;1089:177–193. - PubMed
-
- Carruba G. Estrogens and mechanisms of prostate cancer progression. Ann NY Acad Sci. 2006;1089:201–217. - PubMed
Publication types
MeSH terms
Substances
Grants and funding
LinkOut - more resources
Full Text Sources
Medical