. 2008 Jun;26(5):608-17.
doi: 10.1016/j.mri.2007.11.002. Epub 2008 Jan 30.

The detection limit of a Gd3+-based T1 agent is substantially reduced when targeted to a protein microdomain

Affiliations

The detection limit of a Gd3+-based T1 agent is substantially reduced when targeted to a protein microdomain

Kenjiro Hanaoka et al. Magn Reson Imaging. 2008 Jun.

Abstract

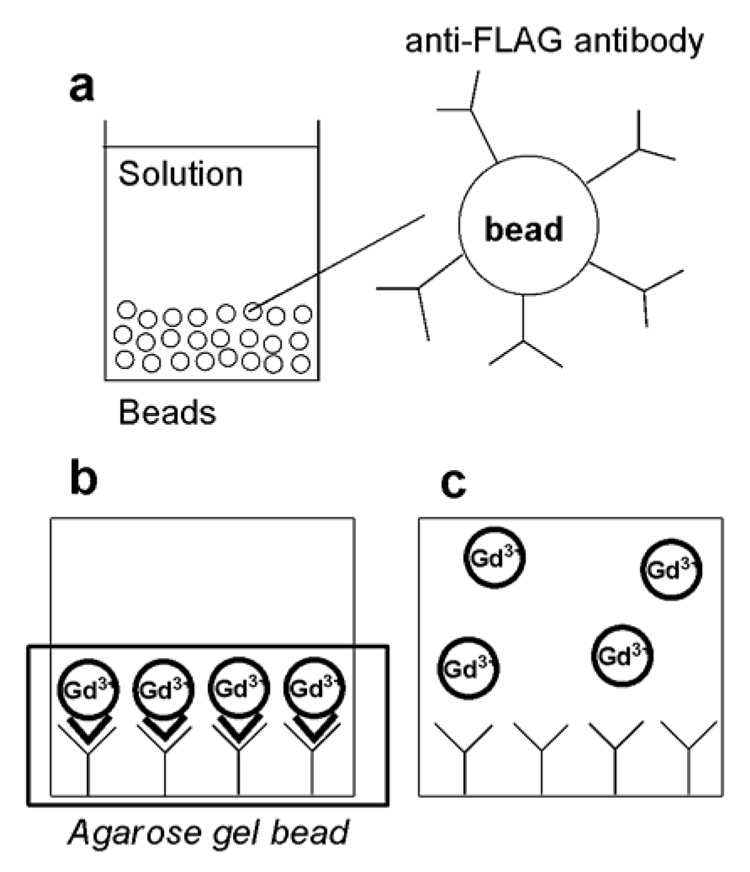
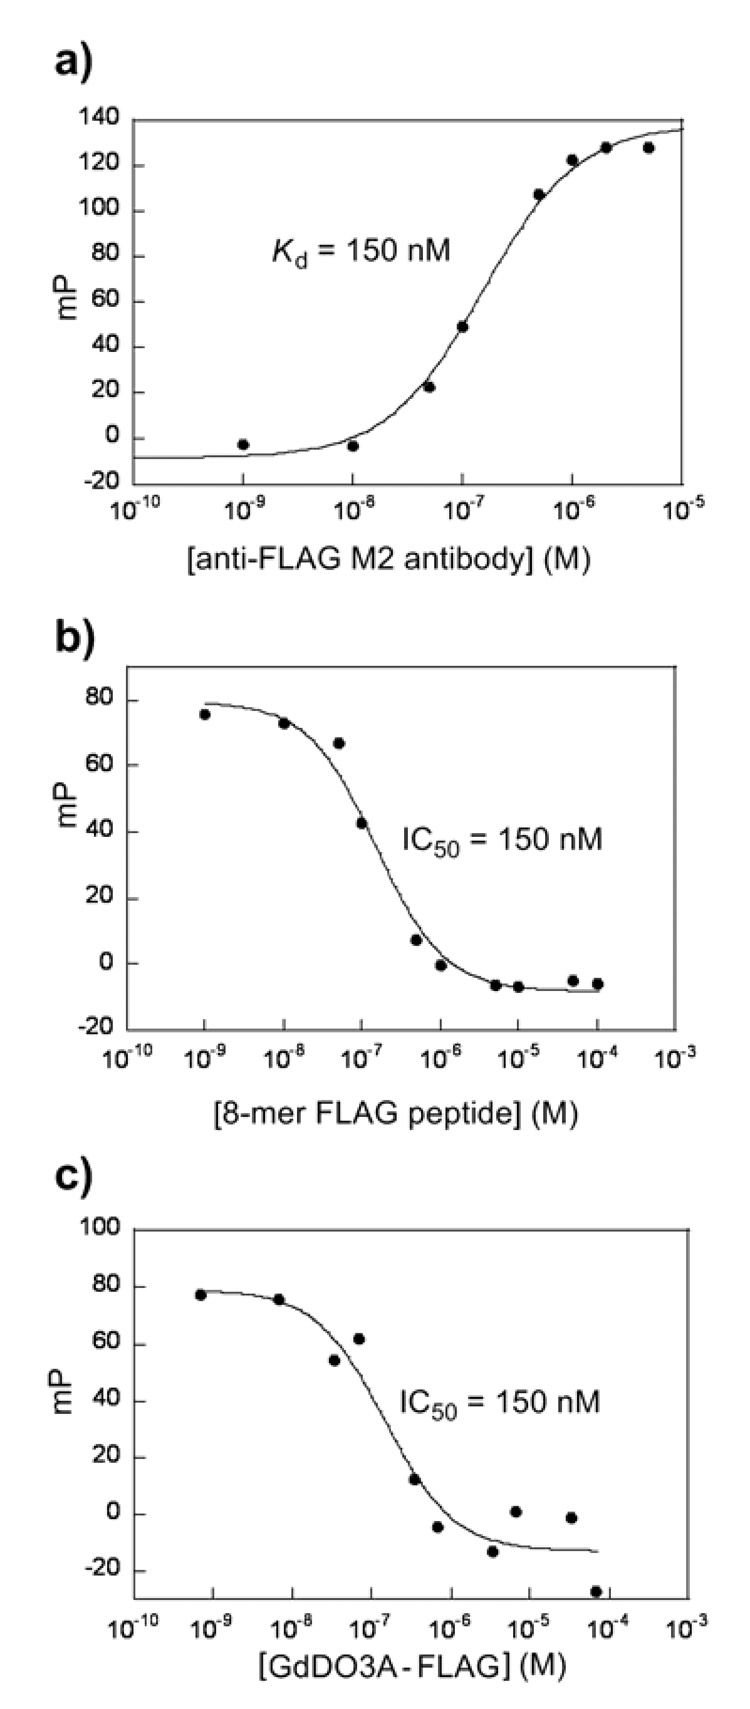
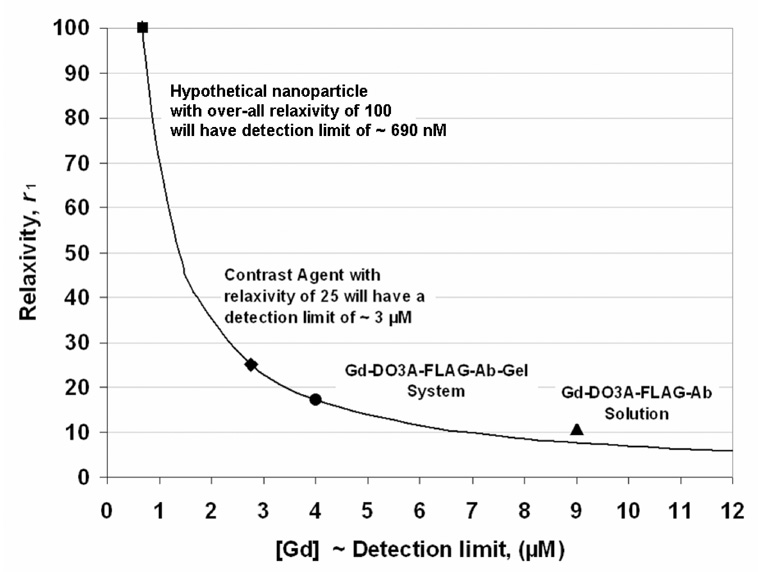
Simple low molecular weight (MW) chelates of Gd(3+) such as those currently used in clinical MRI are considered too insensitive for most molecular imaging applications. Here, we evaluated the detection limit (DL) of a molecularly targeted low MW Gd(3+)-based T(1) agent in a model where the receptor concentration was precisely known. The data demonstrate that receptors clustered together to form a microdomain of high local concentration can be imaged successfully even when the bulk concentration of the receptor is quite low. A GdDO3A-peptide identified by phage display to target the anti-FLAG antibody was synthesized, purified and characterized. T(1-)weighted MR images were compared with the agent bound to antibody in bulk solution and with the agent bound to the antibody localized on agarose beads. Fluorescence competition binding assays show that the agent has a high binding affinity (K(D)=150 nM) for the antibody, while the fully bound relaxivity of the GdDO3A-peptide/anti-FLAG antibody in solution was a relatively modest 17 mM(-1) s(-1). The agent/antibody complex was MR silent at concentrations below approximately 9 microM but was detectable down to 4 microM bulk concentrations when presented to antibody clustered together on the surface of agarose beads. These results provided an estimate of the DLs for other T(1)-based agents with higher fully bound relaxivities or multimeric structures bound to clustered receptor molecules. The results demonstrate that the sensitivity of molecularly targeted contrast agents depends on the local microdomain concentration of the target protein and the molecular relaxivity of the bound complex. A model is presented, which predicts that for a molecularly targeted agent consisting of a single Gd(3+) complex with bound relaxivity of 100 mM(-1) s(-1) or, more reasonably, four tethered Gd(3+) complexes each having a bound relaxivity of 25 mM(-1) s(-1), the DL of a protein microdomain is approximately 690 nM at 9.4 T. These experimental and extrapolated DLs are both well below current literature estimates and suggests that detection of low MW molecularly targeted T(1) agents is not an unrealistic goal.


Figures

FIG. 1
FIG. 1
Schematic representation of the model. (a) Anti-FLAG® M2-Agarose Affinity Gel beads are used as a model of highly concentrated cell surface receptors. (b) Upon addition of a GdDO3A-FLAG conjugate, the probe concentrates onto the antibody surface. (c) Addition of non-specific GdDOTA as a control.
FIG. 2
FIG. 2
Chemical structure of the GdDO3A-FLAG peptide conjugate, and the FLAG-FL conjugate.
FIG. 3
FIG. 3
Fluorescence polarization assay of determination of the apparent dissociation constant Kd of FLAG-FL with anti-FLAG M2 antibody (a), and competition binding curves for 8-mer FLAG peptide (b) and FLAG-GdDO3A (c). The curve for the determination of Kd (a) with 2.5 nM FLAG-FL in TBS buffer at 24°C upon the addition of increasing amounts of anti-FLAG M2 antibody: 0, 0.01, 0.05, 0.1, 0.5, 1.0, 2.0, and 5.0 µM. Competition binding experiments were done at 24 °C by titrating 8-mer FLAG peptide (b) (0.001, 0.01, 0.05, 0.1, 0.5, 1, 5, 10, 50, and 100 µM) or the GdDO3A-FLAG (c) (0.00068, 0.0068, 0.034, 0.068, 0.34, 0.68, 3.4, 6.8, 34, and 68 µM) into a solution containing 2.5 nM FLAG-FL with 100 nM anti-FLAG M2 antibody in a final volume of 100 µl of TBS buffer containing 1 µM of BSA. The data were fit by nonlinear regression to a 1:1 binding competitive model. The fitted curve in (a) corresponds to Kd of 150 nM and the competition binding data of (b) and (c) correspond to IC50 values of 150 nM and 150 nM, respectively.
FIG. 4
FIG. 4
Relative enhancement (ε*) of the paramagnetic longitudinal relaxation rate 1/T1p of water protons for 22 µM solution of GdDO3A-FLAG in the presence of various concentrations of anti-FLAG M2 antibody. The antibody concentration was varied from 0 to 23 µM.
FIG. 5
FIG. 5
MR images of Anti-FLAG® M2-Agarose Affinity Gel beads with GdDO3A-FLAG solutions in capillary tubes. The agarose gel beads were incubated with various concentrations of GdDO3A-FLAG (0, 0.1, 0.3, 0.7, 3.4, or 6.8 µM), and the agarose gel beads and solutions were placed in capillary tubes for imaging. Seven capillary tubes were position in an approximate circle (a capillary at the center was surrounded by six capillary tubes). The capillary tube at the center contains only water while the six capillary tubes surrounding the central tube contain agarose gel beads with various concentrations of GdDO3A-FLAG solutions (6.8*, 3.4, 0.7, 0.3, 0.1, and 0 µM, clockwise). T1-weighted MR images (TR/TE = 300 ms/8.5 ms, FOV = 15 × 15 mm, slice thickness = 2 mm, matrix = 128 × 128; voxel dimensions = 117 µm × 117 µm × 2 mm, an elongated voxel) were collected axially through the agarose gel bead layer of seven capillary tubes.
FIG. 6
FIG. 6
The relative MRI signal intensities showing the accumulation of GdDO3A-FLAG on Anti-FLAG® M2-Agarose Affinity Gel beads in capillary tubes. Agarose gels were incubated with increasing amounts of GdDO3A-FLAG(0, 0.1, 0.3, 0.7, 3.4, or 6.8µM) for 1 hr at room temperature and mildly agitated without (circles) or with (triangles) 8-mer FLAG peptide (400 µM) as a competitor in binding to the anti-FLAG antibody (TR/TE = 300 ms/8.4 ms, FOV = 20 × 20 mm, matrix = 128 × 128; voxel dimensions = 0.16 mm × 0.16 mm × 2 mm, an elongated voxel). The data shown as solid circles were measured from the images of Fig. 5. The various concentrations of GdDO3A-FLAG solutions (0, 0.1, 0.3, 0.7, 3.4, or 6.8 µM) without agarose gel beads in capillary tubes were also measured (squares) (TR/TE = 300 ms/8.4 ms, FOV = 30 × 30 mm, matrix = 128 × 128; voxel dimensions = 0.23 mm × 0.23 mm × 2 mm, an elongated voxel). All voxel counts for ROIs ≥ 24.
FIG. 7
FIG. 7
a,b: T1-weighted axial images (TR/TE = 400 ms/11 ms, FOV = 40 × 40 mm, slice thickness = 2 mm, matrix = 128 × 128) of 3 × 5 wells. Anti-FLAG® M2-Agarose Affinity Gel beads (ca. 50 µl) were added to each well and various concentrations (0, 0.7, 3.4, 6.8, 13.6 µM (left to right)) of GdDO3A-FLAG peptide in TBS buffer was layered above each gel surface (a). Duplicate samples of GdDO3A-FLAG peptide were prepared in two rows. The various concentrations (0, 0.7, 3.4, 6.8, 13.6 µM (left to right)) of GdDOTA in TBS buffer was added to the remaining row (b). c: T1-weighted axial images (TR/TE = 400 ms/8.5 ms, FOV = 30 × 30 mm, matrix = 128 × 128; voxel dimensions = 0.23 mm × 0.23 mm × 2 mm, an elongated voxel) of 3 × 3 wells through the agarose gel bead phase. Rows S, F, P are Streptavidin agarose affinity gel beads (ca. 80 µl), anti-FLAG M2 agarose affinity gel beads (ca. 80 µl), and protein A agarose affinity gel beads (ca. 80 µl) respectively (up to down), and columns 1, 2, 3 are 6.8 µM GdDO3A-FLAG peptide (50 µl), 6.8 µM GdDOTA (50 µl), and TBS buffer (50 µl) respectively (left to right). The samples were incubated at 4°C overnight before collection of the imaging data. d: T1-weighted coronal images (inversion recovery spin echo sequence, 9.4T, TR = 6.5 s, TI = 500 ms, TE = 8.5 ms, FOV = 30 × 30 mm, matrix = 128 × 128; voxel dimensions = 0.23 mm × 0.23 mm × 2 mm, an elongated voxel) of the middle row of the 3 × 3 well used in (c).
FIG 8
FIG 8
Plot of agent relaxivity versus the detection limit based upon Equation 6. The (T1P−1)DL = 0.069 s−1 of the GdDO3A-FLAG peptide bound to Anti-FLAG gel beads (i.e., the product,GdDO3A-FLAG-Ab- Gel system, with relaxivity, r1 = 17.2 mM−1s−1), and the [Gd] at the detection limit (~ 4 µM)) was held constant for the curve. This constant corresponds to the smallest difference in T1 that the MRI can discriminate at these imaging conditions. This curve corresponds to a sensitivity, i.e., a ΔT10 requirement, of 514 ms at T0 = 3000 ms or 65 ms at T0 =1000 ms. The corresponding r1 at the detection limits for GdDO3A-FLAG-Ab-Gel system (circle), GdDO3A-FLAG-Ab in solution (triangle; (T1P−1)DL = 0.096 s−1 ), hypothetical target particles/agents with r1 of 100 mM−1s−1 (square) and 25 mM−1s−1 (diamond) are shown.

References

    1. Tóth É, Helm L, Merbach AE. The chemistry of contrast agents in medical magnetic resonance imaging. In: Merbach AE, Tóth É, editors. Relaxivity of gadolinium(III) complexes: theory and mechanism. Chichester: John Wiley & Sons; 2001. pp. 45–119.
    1. Caravan P, Ellison JJ, McMurry TJ, Lauffer RB. Gadolinium(III) chelates as MRI contrast agents: structure, dynamics, and applications. Chem Rev. 1999;99:2293–2352. - PubMed
    1. Aime S, Botta M, Fasano M, Terreno E. Prototropic and water-exchange processes in aqueous solutions of Gd(III) chelates. Acc Chem Res. 1999;32:941–949.
    1. Sipkins DA, Cheresh DA, Kazemi MR, Nevin LM, Bednarski MD, Li KCP. Detection of tumor angiogenesis in vivo by αvβ3-targeted magnetic resonance imaging. Nat Med. 1998;4:623–626. - PubMed
    1. Tiefenauer LX, Kühne G, Andres RY. Antibody-magnetite nanoparticles: in vitro characterization of a potential tumor-specific contrast agent for magnetic resonance imaging. Bioconjugate Chem. 1993;4:347–352. - PubMed

Publication types