. 2008 Apr 1;40(2):644-654.
doi: 10.1016/j.neuroimage.2007.11.059. Epub 2007 Dec 15.

The respiration response function: the temporal dynamics of fMRI signal fluctuations related to changes in respiration

Affiliations

The respiration response function: the temporal dynamics of fMRI signal fluctuations related to changes in respiration

Rasmus M Birn et al. Neuroimage. .

Abstract

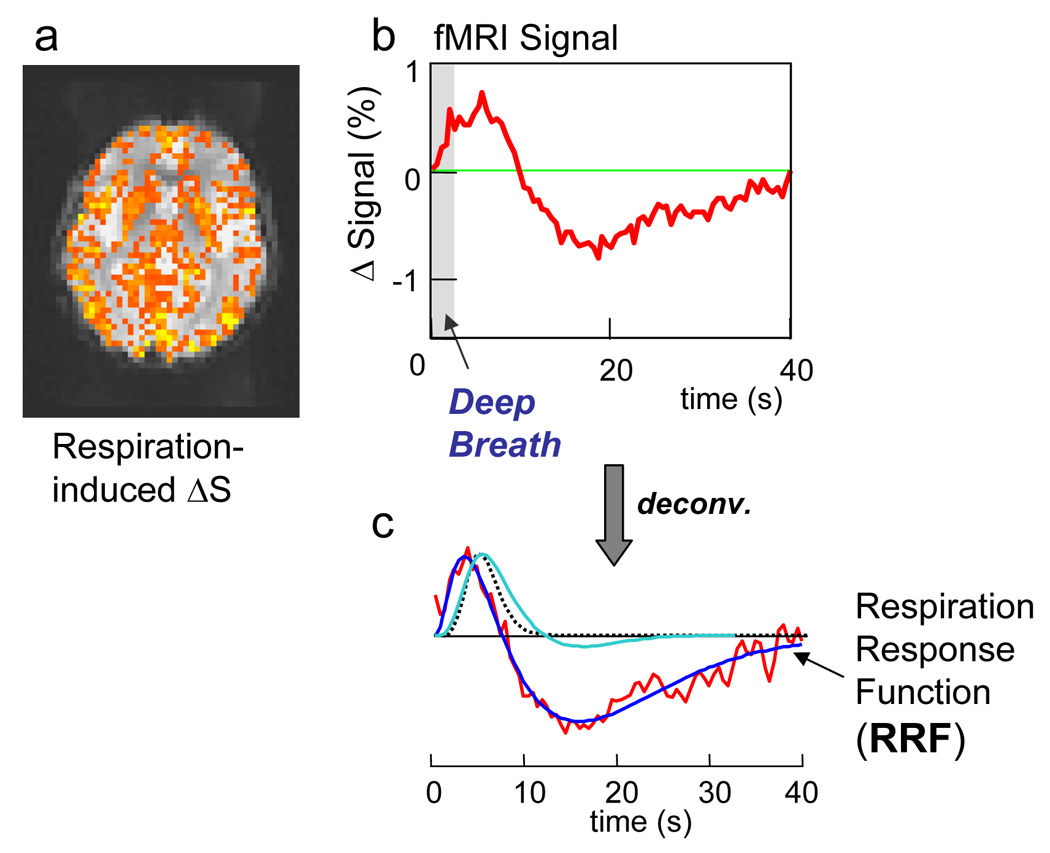
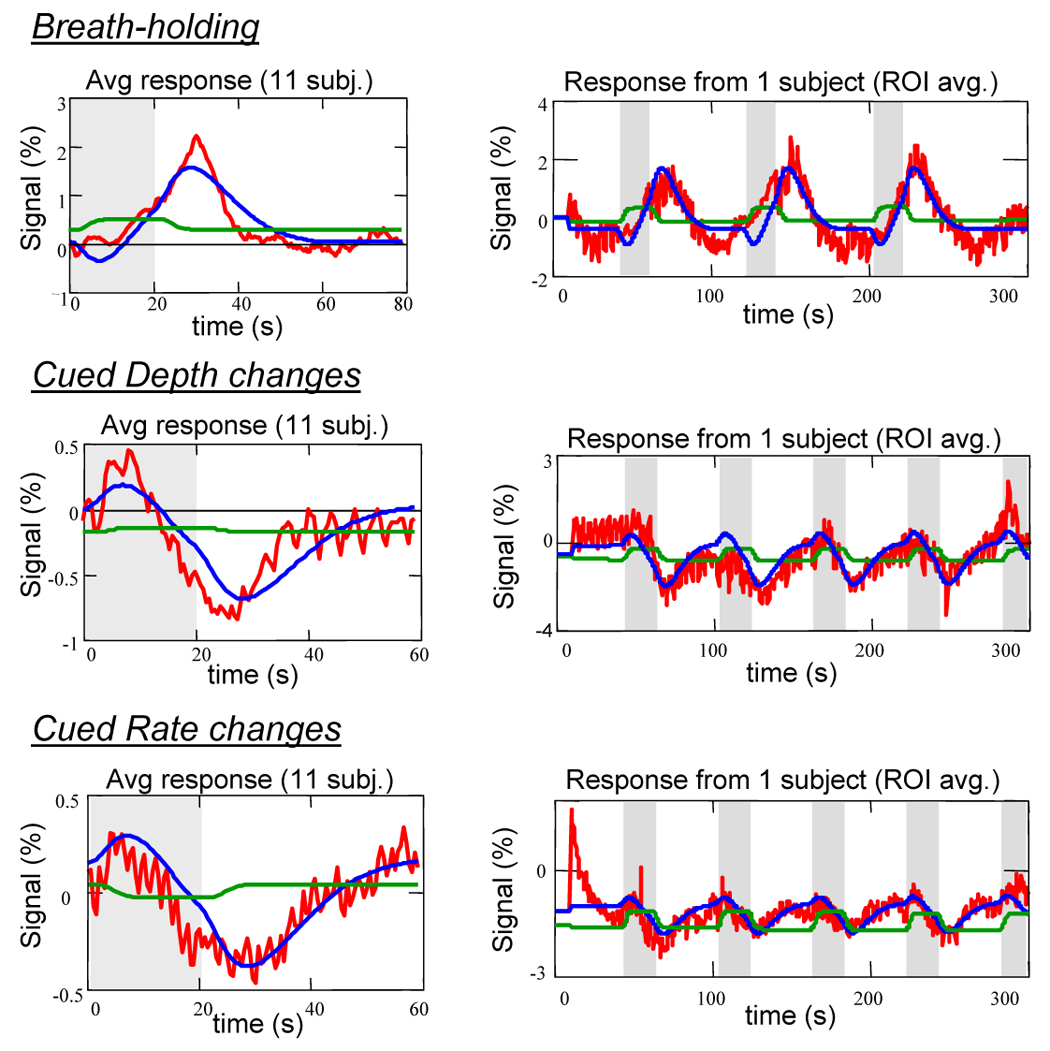
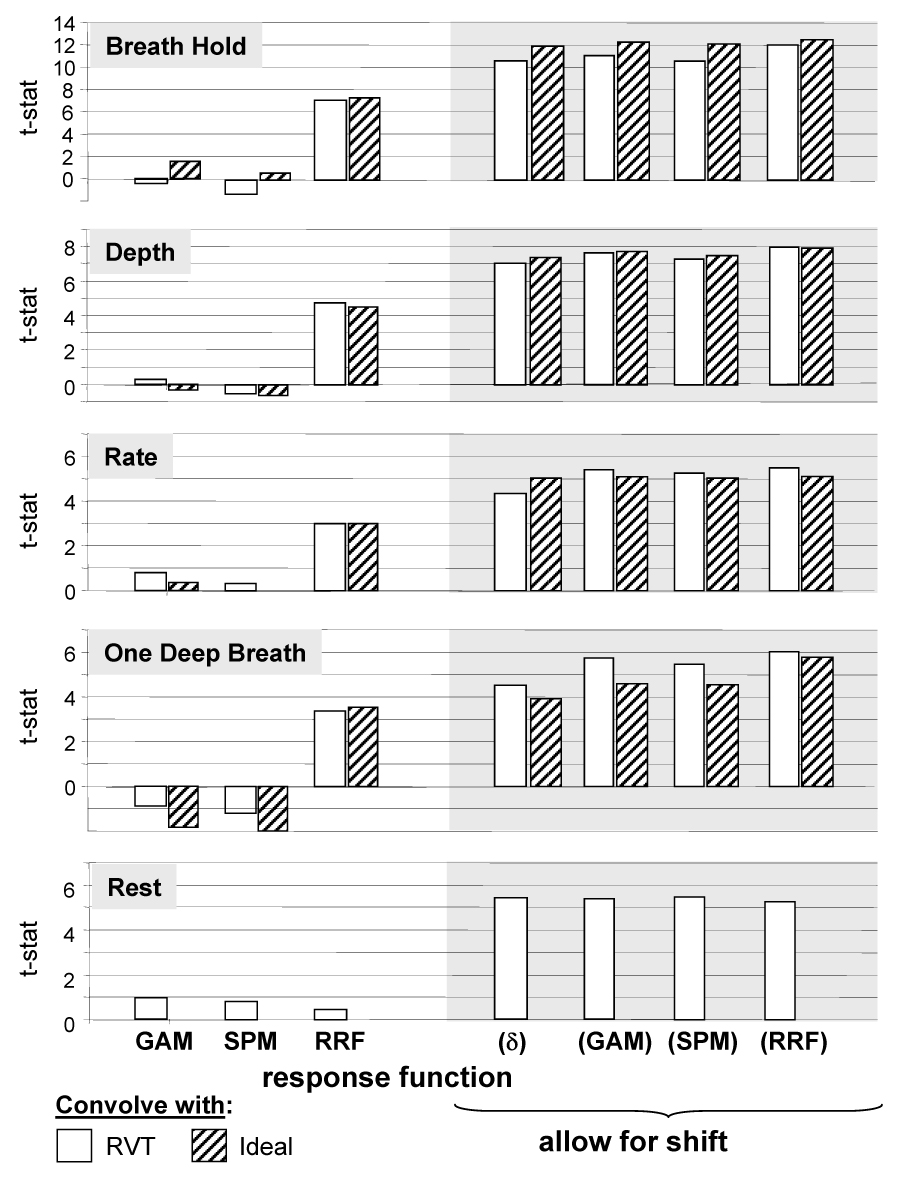
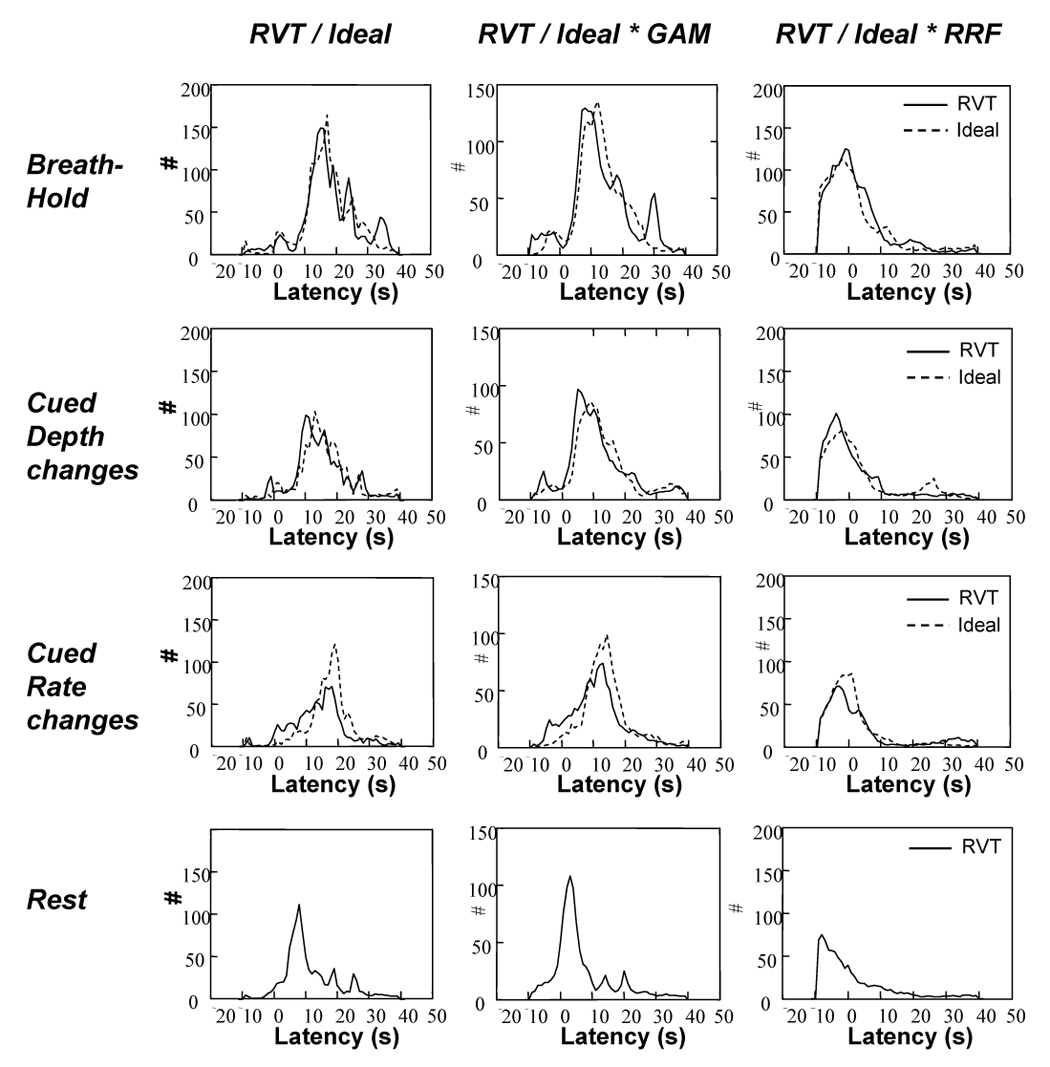
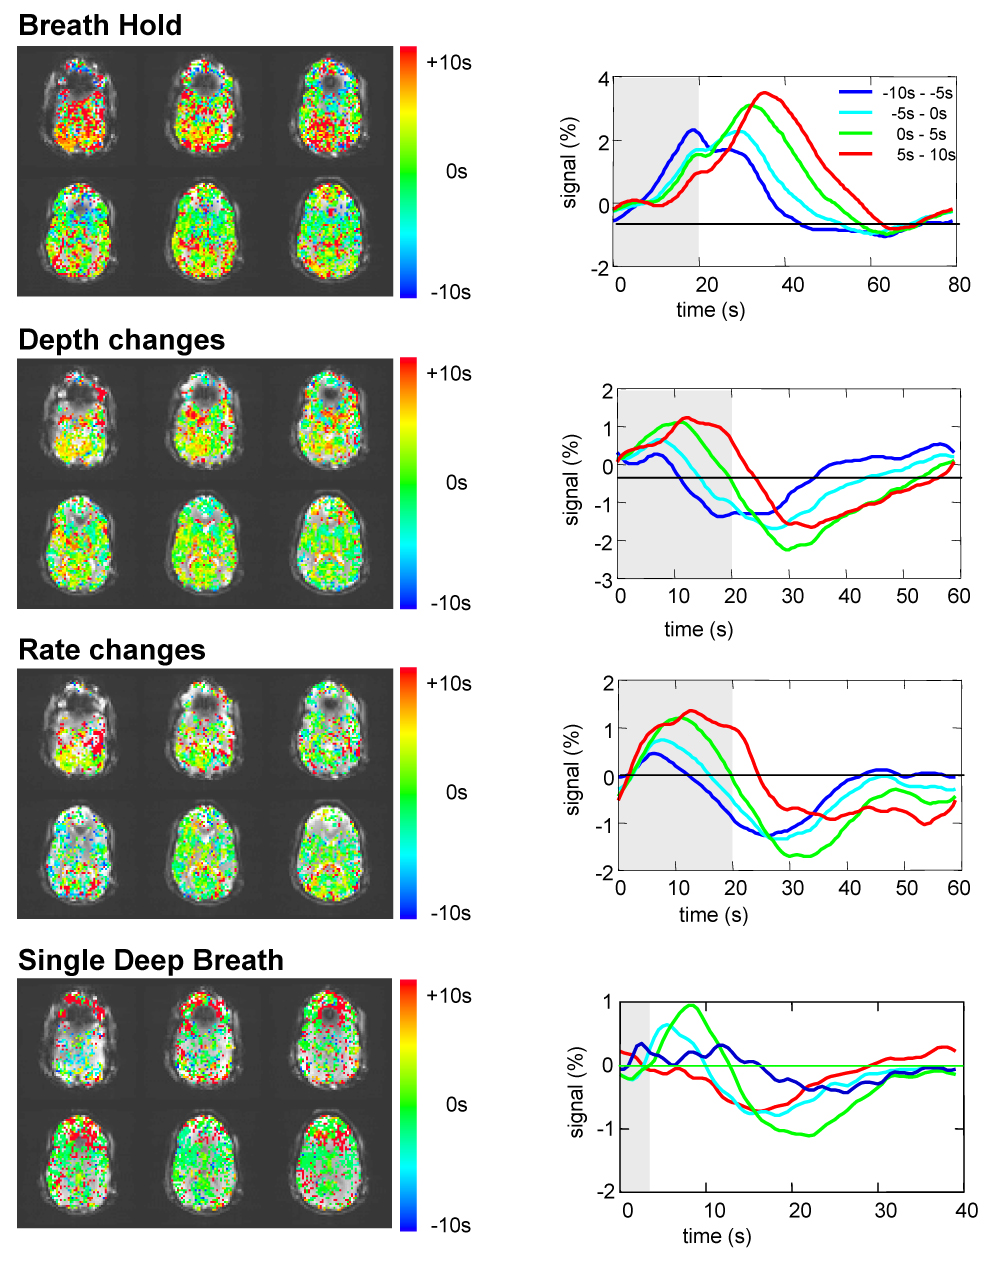
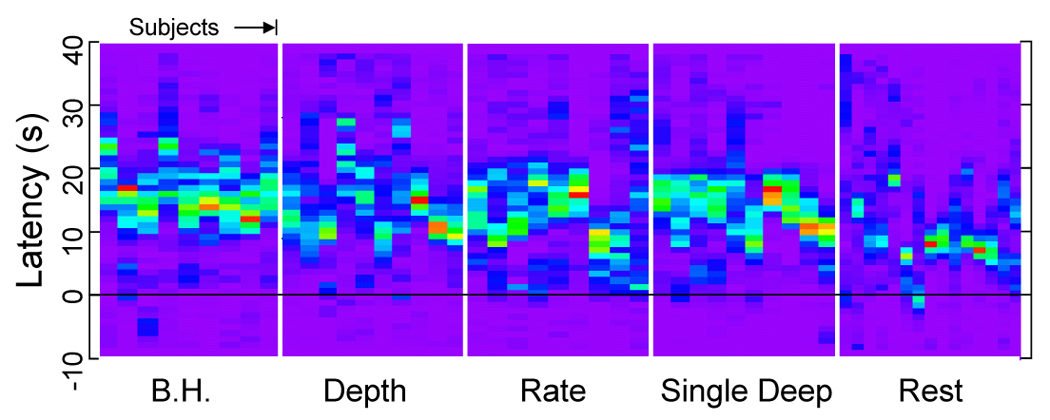
Changes in the subject's breathing rate or depth, such as a breath-hold challenge, can cause significant MRI signal changes. However, the response function that best models breath-holding-induced signal changes, as well as those resulting from a wider range of breathing variations including those occurring during rest, has not yet been determined. Respiration related signal changes appear to be slower than neuronally induced BOLD signal changes and are not modeled accurately using the typical hemodynamic response functions used in fMRI. In this study, we derive a new response function to model the average MRI signal changes induced by variations in the respiration volume (breath-to-breath changes in the respiration depth and rate). This was done by averaging the response to a series of single deep breaths performed once every 40 s amongst otherwise constant breathing. The new "respiration response function" consists of an early overshoot followed by a later undershoot (peaking at approximately 16 s), and accurately models the MRI signal changes resulting from breath-holding as well as cued depth and rate changes.


Figures

Figure 1
Figure 1
a) Respiration-induced signal changes in one slice from a representative subject in response to a deep breath. Colors show regions significantly time-locked with the cued deep breath (i.e. the F-statistic of the deconvolution analysis). b) averaged signal time course in response to a single deep breath. c) red: impulse response function derived from a Wiener deconvolution of the averages response to a single deep breath. Dark blue: ideal fit representing the Respiration Response Function. Dotted line shows the typical gamma-variate HRF typically used to model activation induced BOLD fMRI signal changes. The light-blue line shows the canonical HRF used on SPM, based on a difference of two gamma-variate functions.
Figure 2
Figure 2
Respiration-induced signal changes in one slice from a representative subject during various cued respiration modulations: Breath-holding (BH), cued Depth changes (Depth), cued Rate changes (Rate); or during Rest. Maps show the fit amplitude of fitting the time series of the respiration volume per time (RVT) convolved with the new respiration response function (RRF) (i.e. RVT(t) * RRF(t)) to the data.
Figure 3
Figure 3
Red: Averaged MRI time courses in response to various respiration modulations: Breath-holding, cued Depth changes, and cued Rate changes. Blue curves: fit of RVT convolved with respiration response function. Green curve: fit of RVT time course convolved with typical Gamma-variate used for activation-induce BOLD responses. Figures on left are averaged across 11 subejcts. Figures on right show the entire time course (averaged over the brain) for one representative subject.
Figure 4
Figure 4
T-statistics of fitting either the respiration volume per time (RVT) time course or Ideal stimulus timing convolved with either a gamma-variate (GAM) or the respiration response function to the data from the breath-holding challenge (B.H.), cued depth changes (Depth), cued rate changes (Rate), or Rest. Bars on right allow for a shift between −10s to +40s. For each voxel, the latency that resulted in the best fit was used. (δ) refers to a fit of the RVT time course or ideal response convolved with a delta function – i.e. the RVT time course or ideal response by itself, allowing for a shift.
Figure 5
Figure 5
Histograms of latency values across the brain that resulted in the best voxel-wise fit to the various respiration induced responses. Histograms were computed for each subject, then averaged across subjects.
Figure 6
Figure 6
Left: Maps showing the optimal latency for each voxel in fitting the RVT time course (RVT(t)) convolved with RRF to the different cued respiration changes (breath-hold, cued rate changes, cued depth changes). These values reflect the amount that the RVT(t)*RRF had to be shifted in order to result in the optimal fit. Right: average signal intensity time courses for voxels with the optimal latency within four ranges: (−10s to −5s, −5s to 0s, 0s to 5s, and 5s to 10s).
Figure 7
Figure 7
Histograms of the latency of fitting the respiration volume per time (RVT) time course to each voxel ranging from −10s to +40s (vertical axis), for different tasks and for different runs across subjects (horizontal axis). Each subject has a spread of latency of several seconds in the cued breathing variation runs (B.H. = Breath Hold, Depth = Cued Depth changes, Rate = Cued Rate changes, Single Deep = Cued single deep breath, Rest = Resting run.)

References

    1. Abbott DF, Opdam HI, Briellmann RS, Jackson GD. Brief breath holding may confound functional magnetic resonance imaging studies. Hum Brain Mapp. 2005;24(4):284–290. - PMC - PubMed
    1. Bandettini PA, Wong EC. A hypercapnia-based normalization method for improved spatial localization of human brain activation with fMRI. NMR Biomed. 1997;10(4–5):197–203. - PubMed
    1. Birn RM, Diamond JB, Smith MA, Bandettini PA. Separating respiratory-variation-related fluctuations from neuronal-activity-related fluctuations in fMRI. Neuroimage. 2006;31(4):1536–1548. - PubMed
    1. Brainard DH. The Psychophysics Toolbox. Spat Vis. 1997;10(4):433–436. - PubMed
    1. Brosch JR, Talavage TM, Ulmer JL, Nyenhuis JA. Simulation of human respiration in fMRI with a mechanical model. IEEE Trans Biomed Eng. 2002;49(7):700–707. - PubMed

Publication types