. 2008 May;89(4):379-96.
doi: 10.1016/j.nlm.2007.11.006. Epub 2008 Jan 29.

Genome-wide analysis of aging and learning-related genes in the hippocampal dentate gyrus

Affiliations

Genome-wide analysis of aging and learning-related genes in the hippocampal dentate gyrus

Corinna Burger et al. Neurobiol Learn Mem. 2008 May.

Abstract

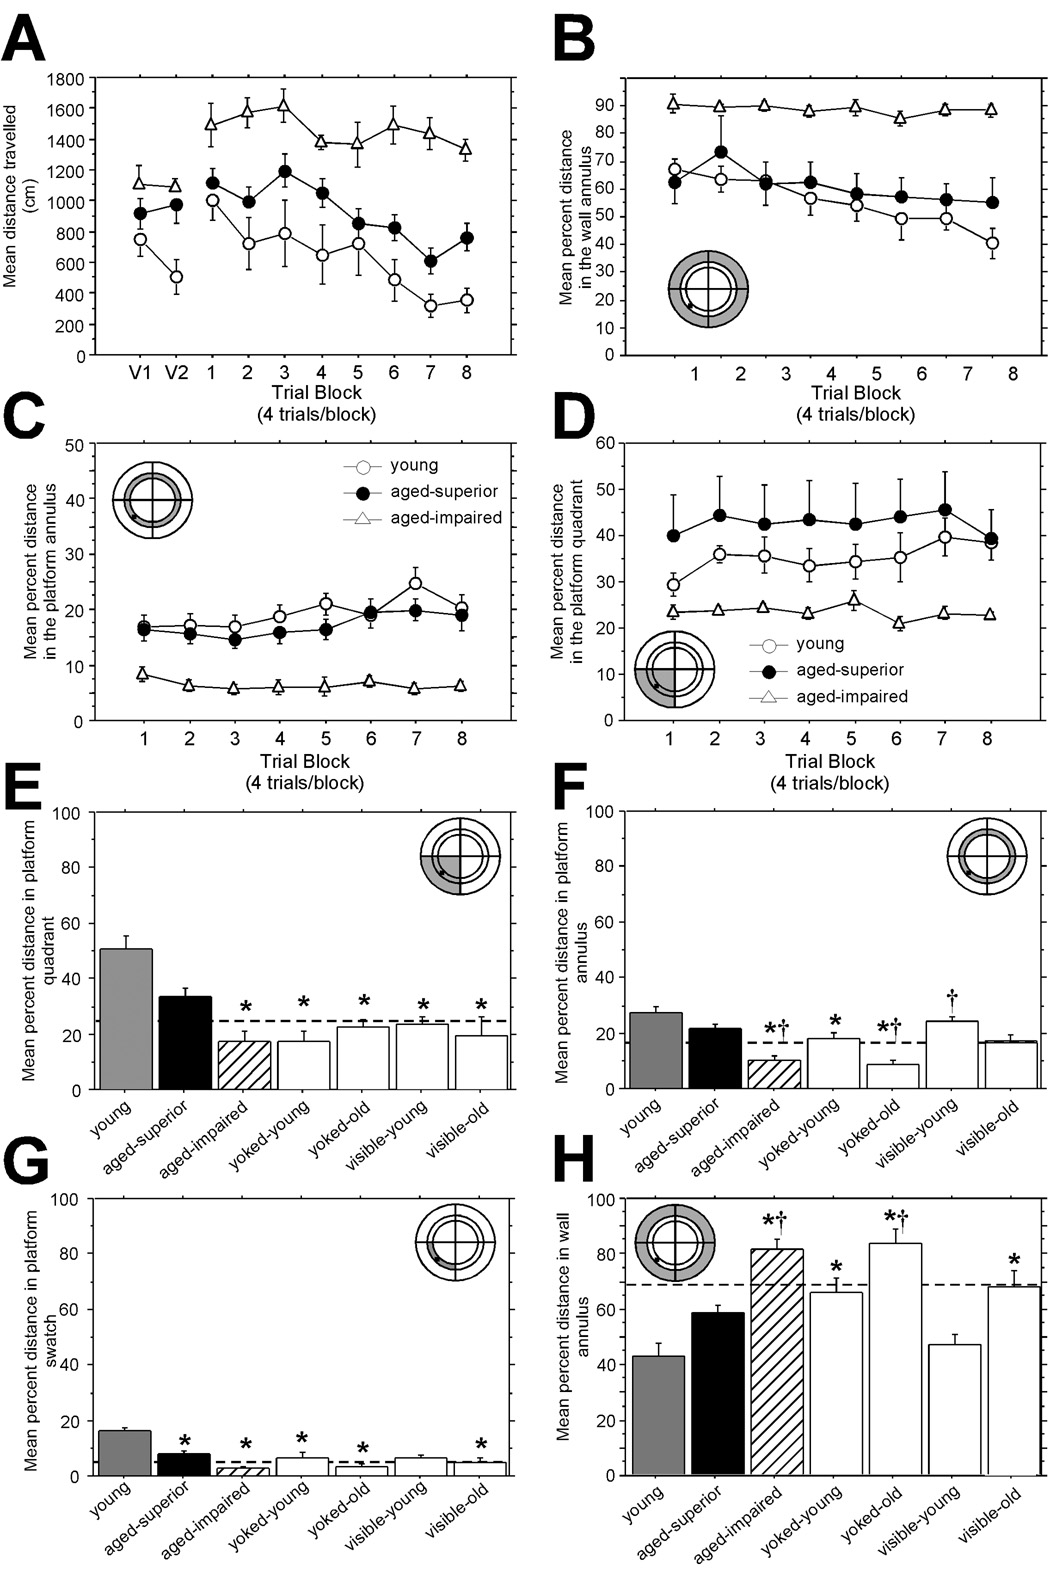
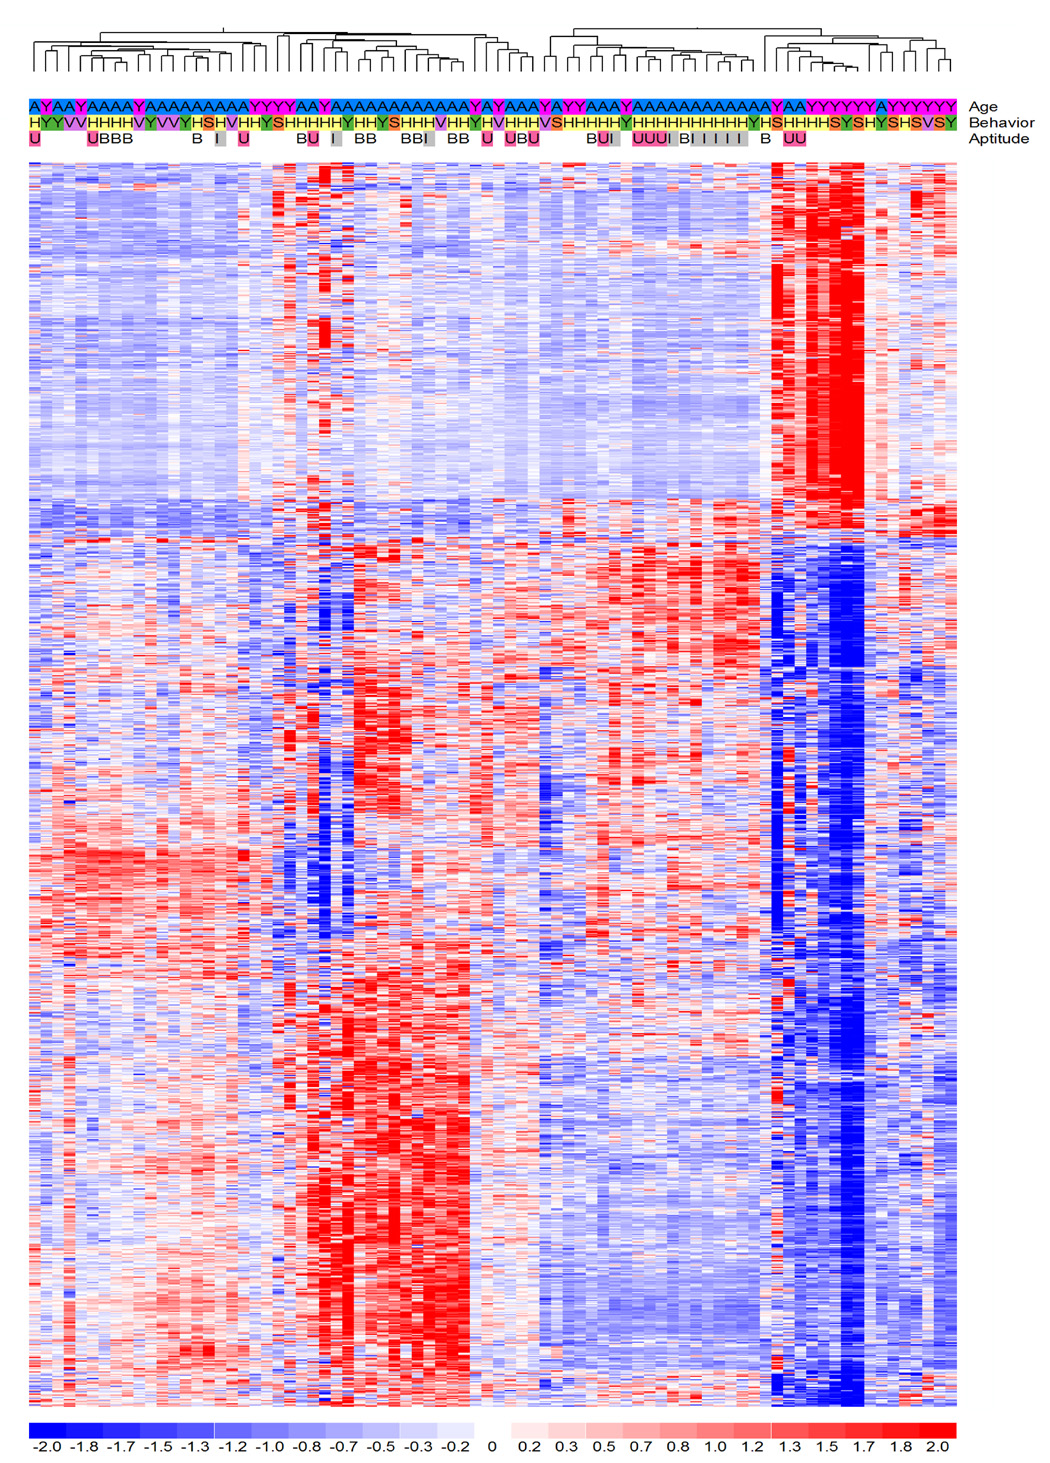
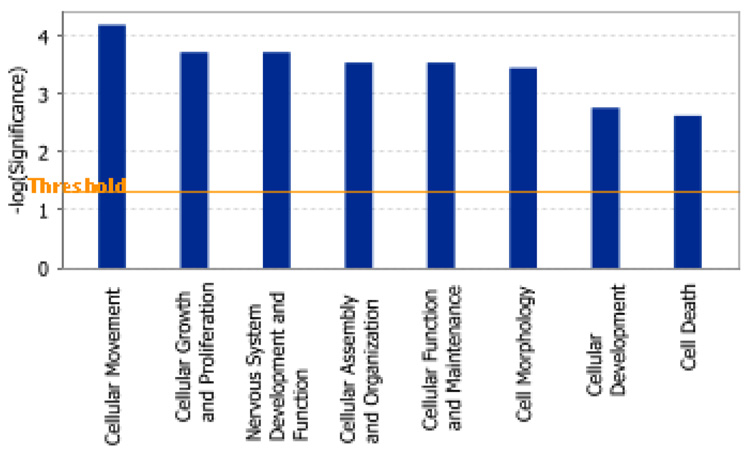
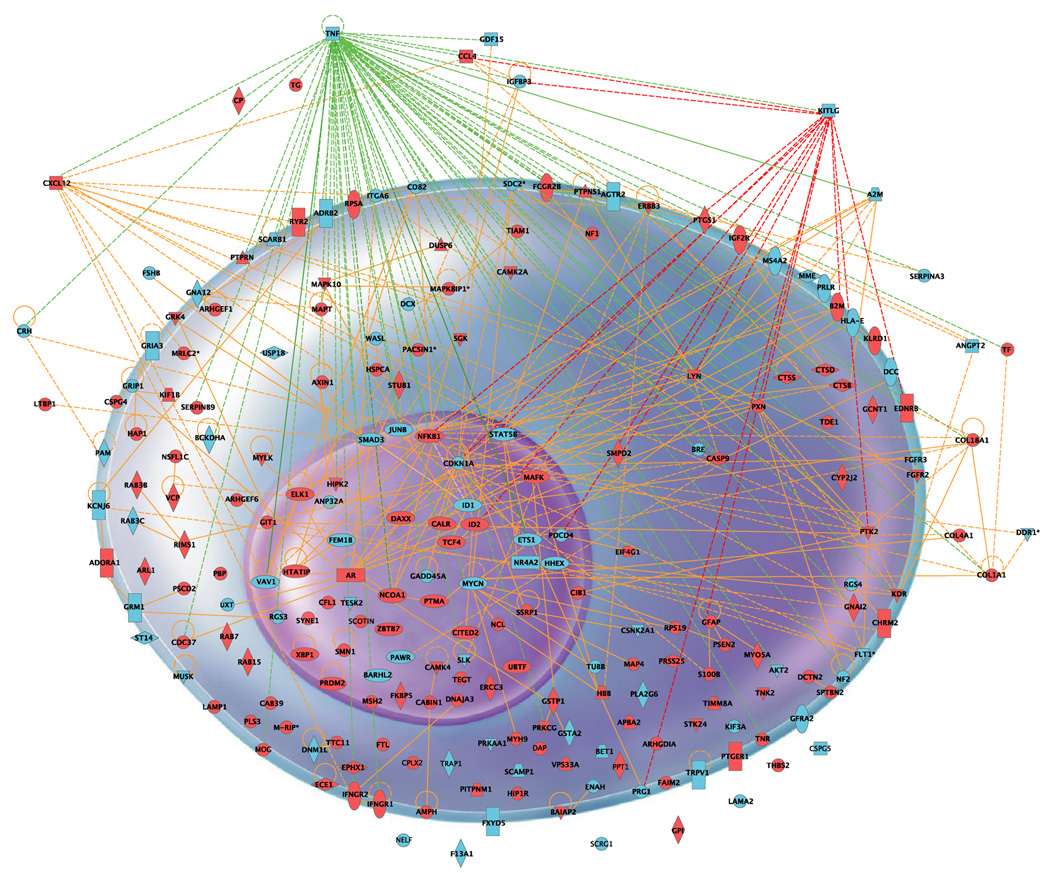
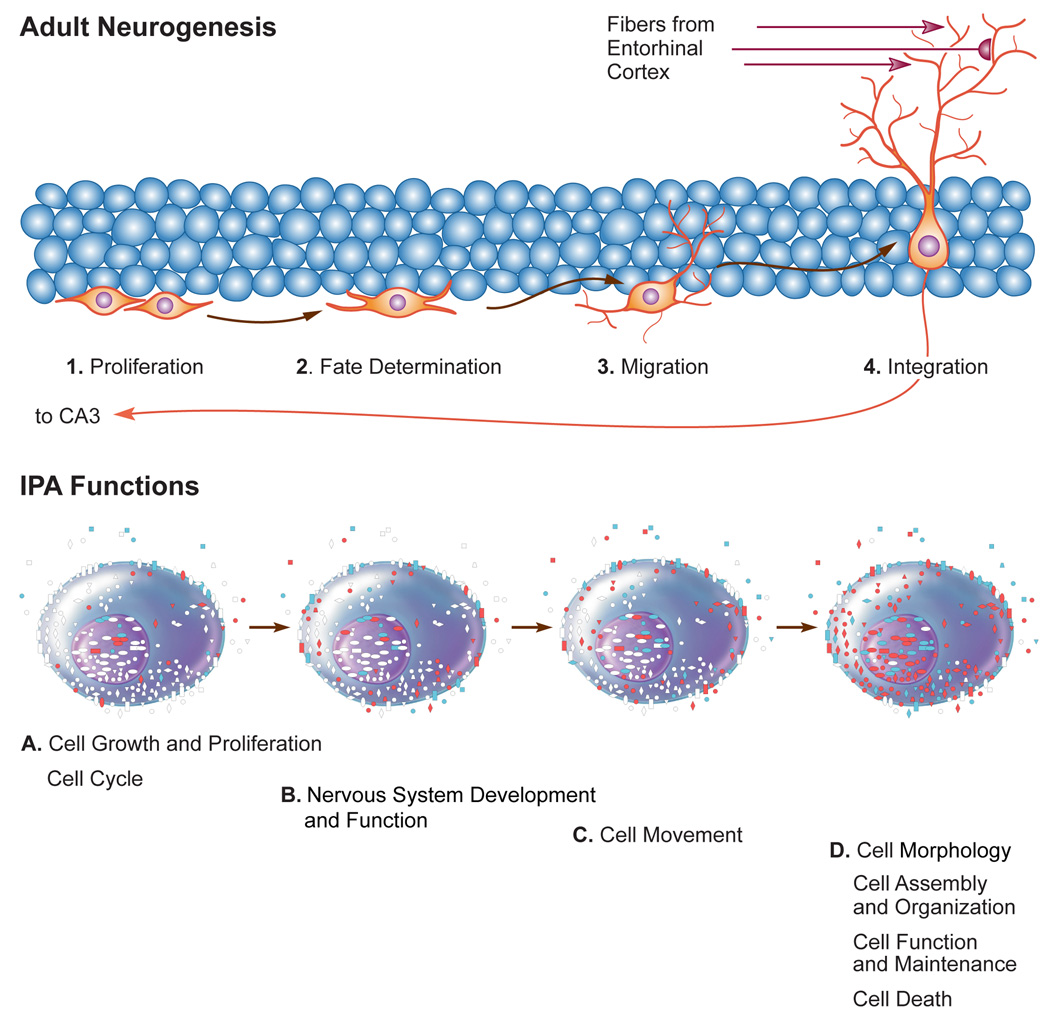
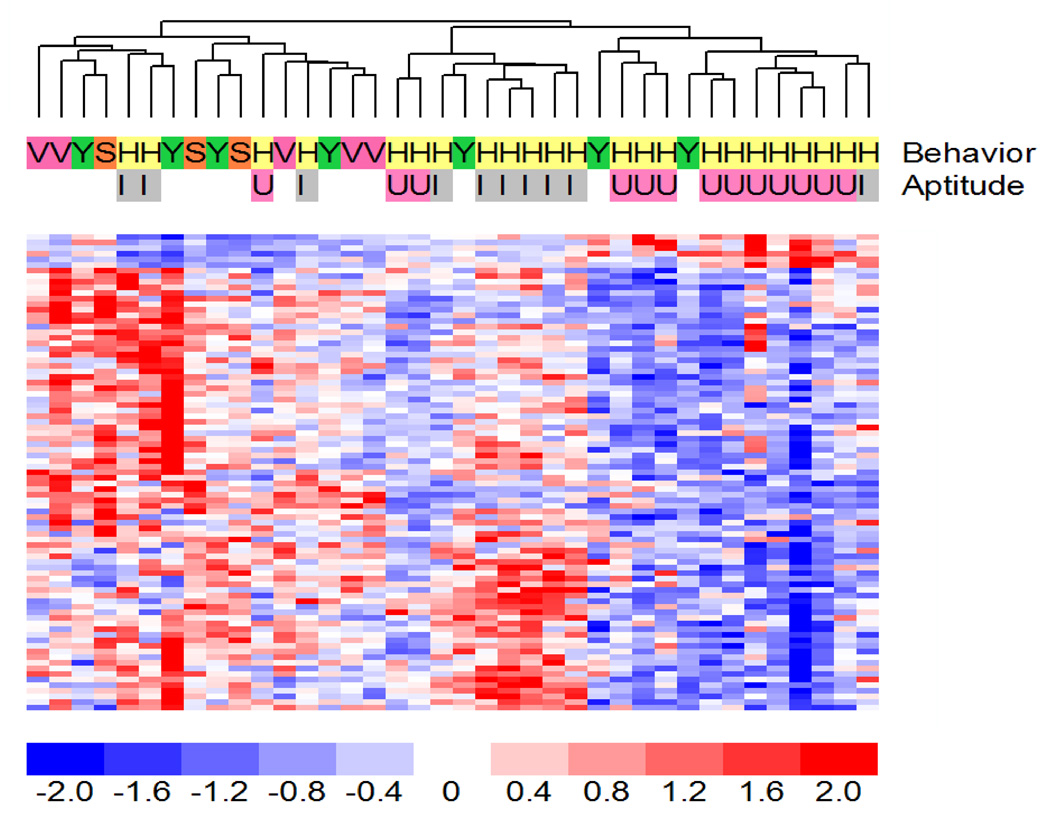
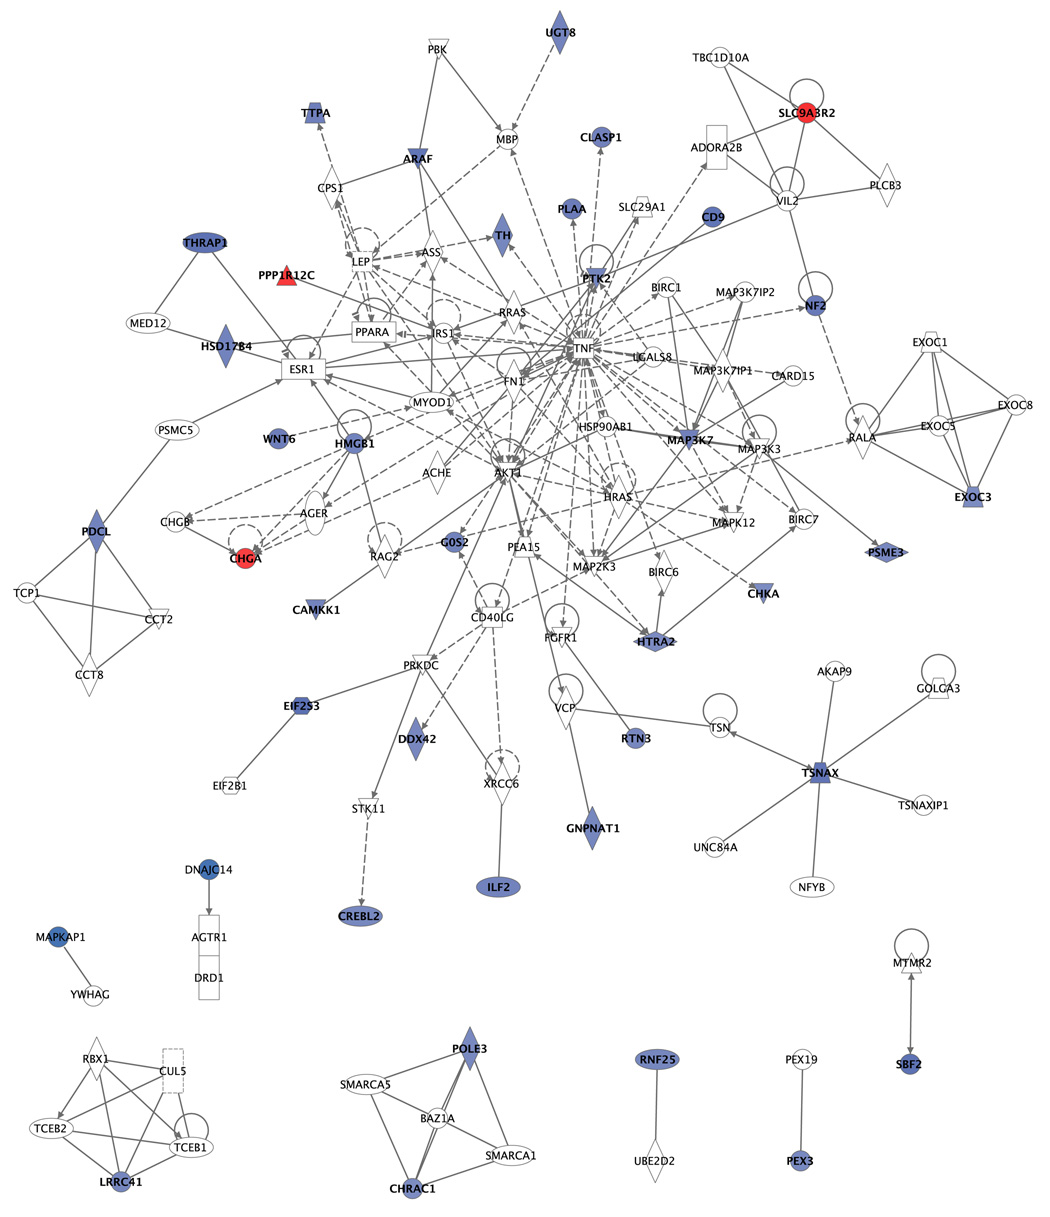
We have previously described the transcriptional changes that occur in the hippocampal CA1 field of aged rats following a Morris Water Maze (MWM) training paradigm. In this report we proceed with the analysis of the dentate region from the same animals. Animals were first identified as age learning-impaired or age-superior learners when compared to young rats based on their performance in the MWM. Messenger RNA was isolated from the dentate gyrus of each animal to interrogate Affymetrix RAE 230A rat genome microarrays. Microarray profiling identified 1129 genes that were differentially expressed between aged and young rats as a result of aging, and independent of their behavioral training (p<0.005). We applied Ingenuity Pathway Analysis (IPA) algorithms to identify the significant biological processes underlying age-related changes in the dentate gyrus. The most significant functions, as calculated by IPA, included cell movement, cell growth and proliferation, nervous system development and function, cellular assembly and organization, cell morphology and cell death. These significant processes are consistent with age-related changes in neurogenesis, and the neurogenic markers were generally found to be downregulated in senescent animals. In addition, statistical analysis of the different experimental groups of aged animals recognized 85 genes (p<0.005) that were different in the dentate gyrus of aged rats that had learned the MWM when compared to learning impaired and a number of controls for stress, exercise and non-spatial learning. The list of learning-related genes expressed in the dentate adds to the set of genes we previously described in the CA1 region. This long list of genes constitutes a starting tool to elucidating the molecular pathways involved in learning and memory formation.


Figures

Figure 1
Figure 1. A schematic representing the experimental design of the MWM testing depicting the conceptual basis for each control group is presented in a previous publication (Burger, Cecilia Lopez et al. 2007)
(A) Visible platform and acquisition curve. The distance traveled by the young animals decreased significantly over the eight days (open circles). Similarly, aged SL animals (closed circles) learned the task but not quite to the efficiency of the young animals. On the other hand, AI animals (open triangles) did not reduce their path length and rarely found the platform. For all individual statistical contrasts, see the text. (B) Path length percentage in the wall annulus is used to evaluate thigmotaxic behavior. Both the young and the aged SL animals swam less over time in the wall annulus while the AI animals essentially only swam near the wall over the entire training period. (C) Path length percentage in the platform annulus. While the young animals searched the most of any group in the platform annulus, both young and the SL animals searched more in the platform annulus than the AI animals. (D) Path length percentage in the platform quadrant. The young animals searched more of their time in the platform quadrant throughout the training period than either aged group. The aged SL animals increased their searching of the platform quadrant over time but the aged impaired animals never altered their search strategy. Maze schematics in the corner of panels AD: the shaded areas depict the location of the maze pertinent to that panel. (EH) Evaluation of search strategy from the probe trial. (E) Proportion of swimming in the platform quadrant. The dashed line indicates the proportion of the MWM taken up by this quadrant (25%). Asterisks indicate a significant difference from young animals. Young and aged superior learners used a spatial learning strategy as shown by the increased amount of path length in the platform quadrant. AI rats searched an identical amount in the platform quadrant as animals that did not learn the spatial task. (F) Proportion of searching in the platform annulus. The dashed line indicates the percent of the MWM area occupied by the platform annulus (17%). The asterisks indicate significant differences from young animals and daggers (†) indicate significant differences from aged SL. The SL animals searched the platform annulus as much as the young animals while the AI animals rarely swam in the platform annulus. (G) Proportion of searching in the portion of the platform annulus that is in the platform quadrant. This measure is intended to serve as a more sensitive indicator of whether the animals are using a true spatial strategy by restricting their searching to a small portion of the MWM surrounding the platform (termed, the platform swatch, dashed line indicates 4.5% of the MWM area) versus using a response strategy circling around the platform annulus. Asterisks indicate significant differences from the young group and daggers indicate significant differences from the aged SL animals. A similar pattern was found when evaluating platform entries (data not shown). (H) Proportion of path length in the wall annulus. This analysis was intended to evaluate the animals’ level of thigmotaxia. The dashed line indicates the area of the MWM covered by the wall annulus (67%). Asterisks indicate significant differences from the young animals and daggers indicate a significant difference from aged SL animals. With the exception of the young animals trained on the visible platform, all the other groups displayed similar thigmotaxia to the AI animals whereas both the young and the aged SL animals searched less in the wall quadrant. Maze schematics in the corner of panels EH: the shaded areas depict the location of the maze pertinent to that panel.
Figure 2
Figure 2. Expression Profiles of genes whose expression changed significantly between aged and young rats in the dentate gyrus
Significant (p<0.005) probe sets (1129) were subjected to hierarchical clustering. Different genes are represented by the horizontal rows of pixels, while experimental animals are represented by the vertical rows. The red signal indicates genes whose expression is increasing under the given condition, blue indicates those that are decreasing with a maximum luminescence at two standard deviations. The length of the branch between any two replicates or groups on the dendrogram is a representation of the overall similarity of each global gene expression dataset. Abreviations: A: aged; Y: young; HID I: hidden platform impaired. HID U: hidden platform unimpaired (superior learners); VIS: visible platform control; SIT: cage control; YOKE: yoked control.
Figure 3
Figure 3. Pathway Analysis of the biological processes underlying age-related changes in the dentate
(A) Bar chart representing eight top functional categories identified by IPA as significant for the genes that were differentially expressed in the aged dentate. Functional categories are represented in the × axis. The y axis designates the significance score (negative log of p value, see materials and methods for details). The horizontal line indicates the significance threshold. (B) Age Related changes in expression of genes involved in Neurogenesis. 220 genes were involved in the IPA functions shown in fig3a are shown with their respective interrelationships in the cell. Genes that showed statistically significant increase in expression with aging are depicted in red. Those for which expression is decreased are shown in blue. (C) Diagrammatic representation of the parallel between the cellular stages of neurogenesis and the molecular functions identified by pathway analysis that changed in the senescent dentate gyrus. The top of the image represents the dentate granule cell layer and the different stages associated with adult neurogenesis in the dentate. At the bottom, the Ingenuity Pathway Analysis functions representing the molecular signature of each of the stages in neurogenesis. Each cell shows which of the genes shown in fig 3b represent a given IPA function. Genes that were not part of a given function are depicted in white, while those who were upregulated are shown in red; downregulated genes are shown in blue.
Figure 4
Figure 4
Gene expression patterns of genes whose expression varied between the different experimental groups of aged rats in the dentate. The dendogram shows the hierarchical cluster patterns of the 85 genes identified as significant at the p < 0.005 significance threshold between the aged superior learners and aged impaired and control animals. Gene expression is displayed using a red-blue color scale as in figure 2.
Figure 5
Figure 5. Network representation of the genes identified by IPA in the SL versus CTL comparison (tentative figure)
37 genes were used to generate networks that include interactions between the genes in the network. Genes that are colored in blue were downregulated in the SL compared to controls. Genes in red were upregulated in SL. Genes in white color were not significantly changed in the analysis. They were found by IPA as the “missing links” to network the significant genes in the study.

References

    1. Aitken DH, Meaney MJ. Temporally graded, age-related impairments in spatial memory in the rat. Neurobiol Aging. 1989;10(3):273–276. - PubMed
    1. Alfonso J, Pollevick GD, et al. Identification of genes regulated by chronic psychosocial stress and antidepressant treatment in the hippocampus. Eur J Neurosci. 2004;19(3):659–666. - PubMed
    1. Amat J, M-A P, Watkins LR, Maier SF. Escapable and inescapable stress differentially and selectively alter extracellular levels of 5-HT in the ventral hippocampus and dorsal periaqueductal gray of the rat. brain research. 1998;797(1):12–22. - PubMed
    1. Aloe L, Properzi F, et al. Learning abilities, NGF and BDNF brain levels in two lines of TNF-alpha transgenic mice, one characterized by neurological disorders, the other phenotypically normal. Brain Res. 1999;840(1–2):125–137. - PubMed
    1. Altman J, Das GD. Autoradiographic and histological evidence of postnatal hippocampal neurogenesis in rats. J Comp Neurol. 1965;124(3):319–335. - PubMed

Publication types