. 2008 Mar;135(5):953-62.
doi: 10.1242/dev.014316. Epub 2008 Jan 30.

Formation of the embryonic-abembryonic axis of the mouse blastocyst: relationships between orientation of early cleavage divisions and pattern of symmetric/asymmetric divisions

Affiliations

Formation of the embryonic-abembryonic axis of the mouse blastocyst: relationships between orientation of early cleavage divisions and pattern of symmetric/asymmetric divisions

Marcus Bischoff et al. Development. 2008 Mar.

Abstract

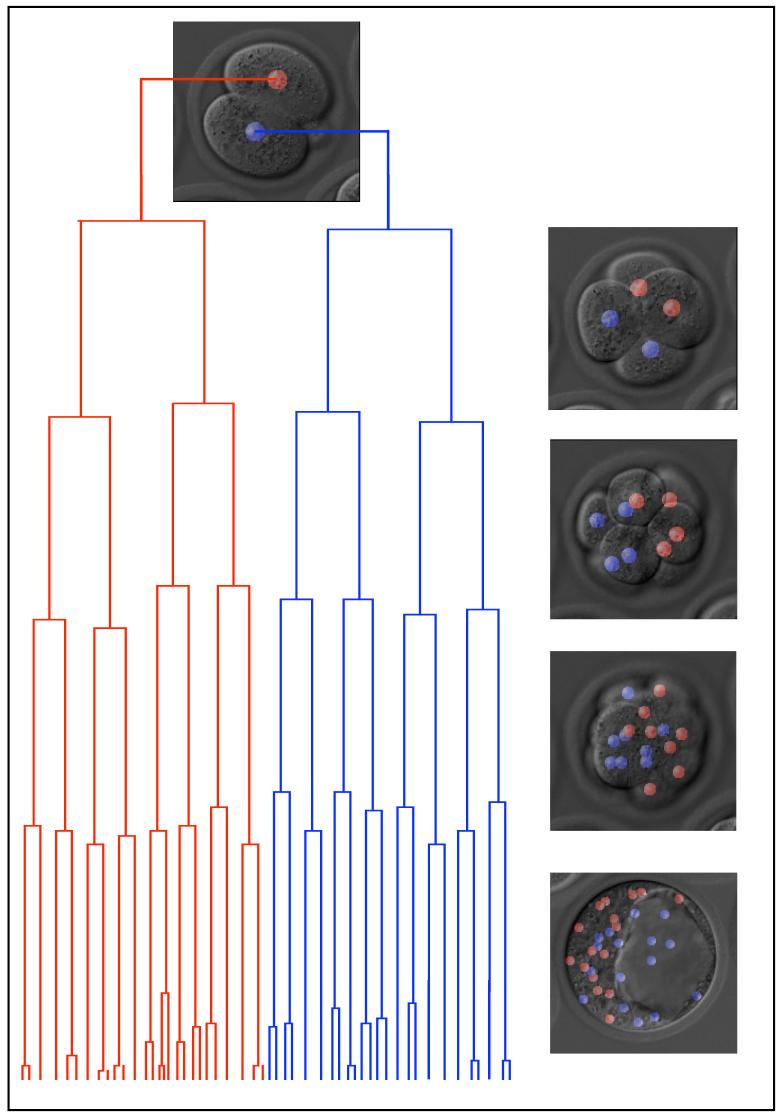
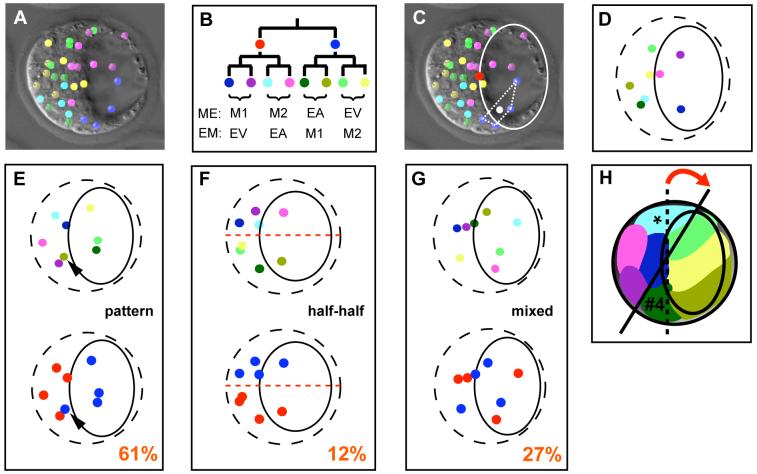
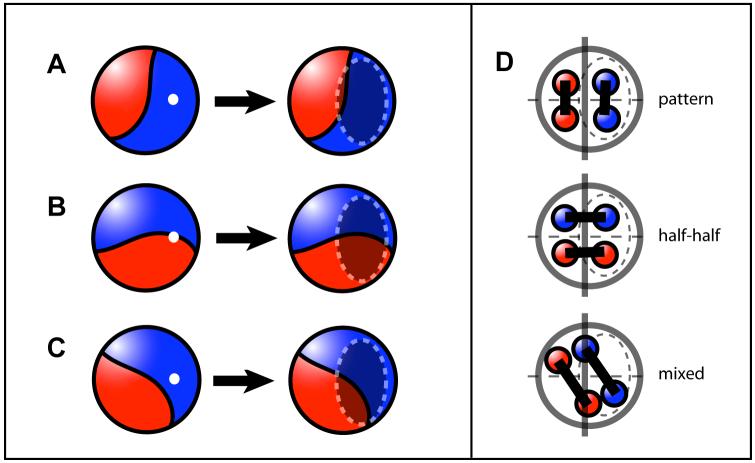
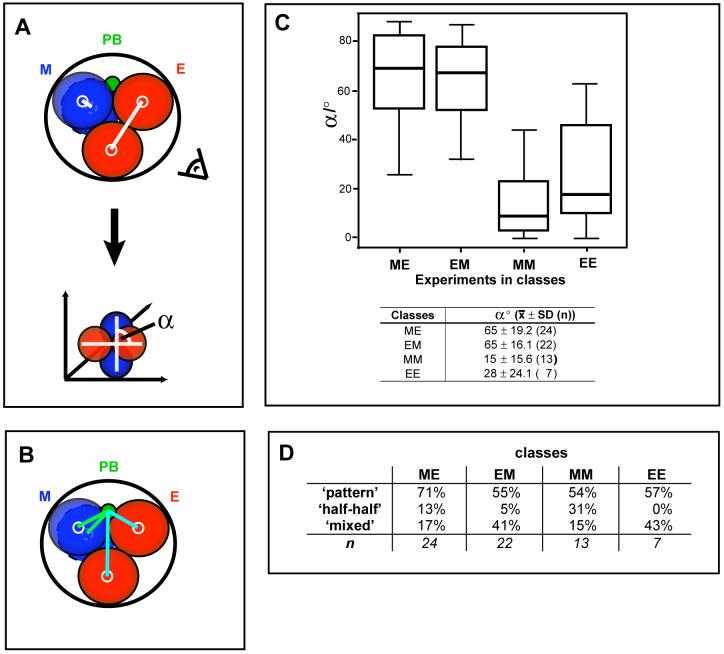
Setting aside pluripotent cells that give rise to the future body is a central cell fate decision in mammalian development. It requires that some blastomeres divide asymmetrically to direct cells to the inside of the embryo. Despite its importance, it is unknown whether the decision to divide symmetrically versus asymmetrically shows any spatial or temporal pattern, whether it is lineage-dependent or occurs at random, or whether it influences the orientation of the embryonic-abembryonic axis. To address these questions, we developed time-lapse microscopy to enable a complete 3D analysis of the origins, fates and divisions of all cells from the 2- to 32-cell blastocyst stage. This showed how in the majority of embryos, individual blastomeres give rise to distinct blastocyst regions. Tracking the division orientation of all cells revealed a spatial and temporal relationship between symmetric and asymmetric divisions and how this contributes to the generation of inside and outside cells and thus embryo patterning. We found that the blastocyst cavity, defining the abembryonic pole, forms where symmetric divisions predominate. Tracking cell ancestry indicated that the pattern of symmetric/asymmetric divisions of a blastomere can be influenced by its origin in relation to the animal-vegetal axis of the zygote. Thus, it appears that the orientation of the embryonic-abembryonic axis is anticipated by earlier cell division patterns. Together, our results suggest that two steps influence the allocation of cells to the blastocyst. The first step, involving orientation of 2- to 4-cell divisions along the animal-vegetal axis, can affect the second step, the establishment of inside and outside cell populations by asymmetric 8- to 32-cell divisions.


Figures

Fig. 1
Fig. 1. 4D analysis of early mouse development
Lineage generated with SIMI Biocell. Merges of 3D representations and DIC images from 2-cell-stage to blastocyst are shown (2-cell-stage descendants are coloured red or blue).
Fig. 2
Fig. 2. Blastocysts show distinctive clonal patterns
(A-D) Embryos were analysed using the centres of gravity of the clones made up of the descendants of the 8-cell-stage blastomeres. (A) Merge of DIC and 3D representation of a blastocyst (Colouring as B). (B) Colours used to code for the 2- and 8-cell-stage descendants. MM and EE embryos were colour coded by placing the first dividing cells in the left lineage. M=meridional 2nd cleavage division (M1 and M2 being their daughters); E=equatorial 2nd cleavage division; EA, EV=descendants of 4-cell blastomeres produced by equatorial division. A=animal, V=vegetal. (C) Determining the centre of gravity of each clone. The centroids (white dot) of the tetragons (white dashed lines) defined by the 8-cell-stage descendants were calculated (example shown for the blue clone). The coordinate of the mid-point of the embryonic-abembryonic boundary (red dot) was used to align an illustration of the cavity (white ellipse). (D) Scheme generated using the method described in (C). Each dot represents the centre of gravity of a single 8-cell clone. The ellipse indicates cavity position and the dashed ellipse the outline of the embryo. (E-G) Schemes representing the three different groups of blastocysts. 8-cell clones (upper row) and 2-cell clones (lower row) use the colour code in (B). The frequency of each group is indicated (n=66). (E) “Embryonic/abembryonic“ pattern. Arrowhead marks region #4. (F) ‘Half-half’ pattern. The dashed line indicates the separation of the 2-cell-stage clones. (G) ‘Mixed” pattern. (H) Schematic embryonic/abembryonic pattern. Colour code as shown in (B). Regions derived from one 2-cell-stage blastomere are positioned in the embryonic part (left). One region reaches slightly into the abembryonic part (asterisk). Three regions of the other 2-cell-stage blastomere are positioned in the abembryonic part (right) - one region (“region #4”/“dovetailed region”) is positioned in the embryonic part (#4). The embryonic-abembryonic boundary is indicated by the dashed line. The presence of region #4 might explain the shift of this axis (red arrow; black line).
Fig. 3
Fig. 3. Model for the generation of blastocyst pattern
The 32-cell embryo consists of two clones derived from 2-cell blastomeres, which show an arrangement reminiscent of a “baseball”. Based on the arrangement of 2-cell-stage clones there are three different possibilities for the positioning of the blastocyst cavity (white dot). (A) The cavity develops within one clone which leads to “embryonic/abembryonic” pattern. (B) The cavity forms over the border between the 2-cell-stage clones which leads to “half-half” pattern. (C) The cavity forms more randomly with respect to the border of the 2-cell clones generating blastocysts with “mixed” pattern. (D) Scheme illustrating the lineage-dependency of the different patterns. Only the embryonic-abembryonic pattern reflects the lineage history with respect to the 2-cell-stage.
Fig. 4
Fig. 4. The influence of the animal-vegetal axis on the generation of different blastocyst patterns
(A)-(C) Classification of embryos according to sequence and orientation of second cleavage divisions. (A) To measure the angle (α) between the division planes of the 2-cell blastomeres (white lines), 3D representations were rotated to look at the angle (illustrated with the eye). (B) Scheme illustrating the measurement of the distance of cells to the polar body (PB, Methods). (C) Box-plot showing relationship between the four classes and α. The table shows average angles for each class (n=sample size). (D) Table showing the frequency of the different blastocyst patterns in each of the four embryo classes.
Fig. 5
Fig. 5. Analysis of division orientation
Analysis of division orientation at the 4th and 5th cleavage divisions. (A) Percentage of asymmetric and symmetric divisions in 4th and 5th cleavage (average ± SEM). (B) Analysis of cell division orientations of the two daughters of an asymmetric (A) or symmetric (S) division in the 4th cleavage round. The possible permutations (shown) differ significantly depending on the orientation of the 4th cleavage (χ2 test, p<0.001). ‘I’ denotes a division where both daughters lie inside the embryo. (C,D) Proportion of asymmetric/symmetric divisions of the 4-cell-stage descendants at 4th and 5th cleavage (average ± SEM) for the four classes. (C) ME and EM embryos, (D) MM and EE embryos. Each pair of columns represents the descendants of one of the 4-cell blastomeres (legend of Fig. 2 for abbreviations).

References

    1. Alarcon VB, Marikawa Y. Deviation of the blastocyst axis from the first cleavage plane does not affect the quality of mouse postimplantation development. Biol Reprod. 2003;69:1208–12. - PubMed
    1. Barlow P, Owen DAJ, Graham CF. DNA synthesis in the preimplantation mouse embryo. J. Embryol. Exp. Morphol. 1972;27:431–435. - PubMed
    1. Chroscicka A, Komorowski S, Maleszewski M. Both blastomeres of the mouse 2-cell embryo contribute to the embryonic portion of the blastocyst. Mol Reprod Dev. 2004;68:308–12. - PubMed
    1. Dietrich JE, Hiiragi T. Stochastic patterning in the mouse pre-implantation embryo. Development. 2007;134:4219–31. - PubMed
    1. Fleming TP. A quantitative analysis of cell allocation to trophectoderm and inner cell mass in the mouse blastocyst. Dev Biol. 1987;119:520–31. - PubMed

Publication types