. 2008 Apr;82(7):3751-68.
doi: 10.1128/JVI.02244-07. Epub 2008 Jan 30.

Redundancy and plasticity of neutralizing antibody responses are cornerstone attributes of the human immune response to the smallpox vaccine

Affiliations

Redundancy and plasticity of neutralizing antibody responses are cornerstone attributes of the human immune response to the smallpox vaccine

Mohammed Rafii-El-Idrissi Benhnia et al. J Virol. 2008 Apr.

Abstract

The smallpox vaccine is widely considered the gold standard for human vaccines, yet the key antibody targets in humans remain unclear. We endeavored to identify a stereotypic, dominant, mature virion (MV) neutralizing antibody target in humans which could be used as a diagnostic serological marker of protective humoral immunity induced by the smallpox vaccine (vaccinia virus [VACV]). We have instead found that diversity is a defining characteristic of the human antibody response to the smallpox vaccine. We show that H3 is the most immunodominant VACV neutralizing antibody target, as determined by correlation analysis of immunoglobulin G (IgG) specificities to MV neutralizing antibody titers. It was determined that purified human anti-H3 IgG is sufficient for neutralization of VACV; however, depletion or blockade of anti-H3 antibodies revealed no significant reduction in neutralization activity, showing anti-H3 IgG is not required in vaccinated humans (or mice) for neutralization of MV. Comparable results were obtained for human (and mouse) anti-L1 IgG and even for anti-H3 and anti-L1 IgG in combination. In addition to H3 and L1, human antibody responses to D8, A27, D13, and A14 exhibited statistically significant correlations with virus neutralization. Altogether, these data indicate the smallpox vaccine succeeds in generating strong neutralizing antibody responses not by eliciting a stereotypic response to a single key antigen but instead by driving development of neutralizing antibodies to multiple viral proteins, resulting in a "safety net" of highly redundant neutralizing antibody responses, the specificities of which can vary from individual to individual. We propose that this is a fundamental attribute of the smallpox vaccine.


Figures

FIG. 1.
FIG. 1.
Relationship between total anti-VACV IgG levels and virus neutralization activity. (A) Anti-VACV IgG levels in plasma samples from 50 smallpox vaccine recipients were quantified by endpoint dilution ELISA. Separately, VACV neutralizing antibody levels were quantified (PRNT50) using the same plasma samples. Data from each donor sample are plotted as anti-VACV IgG versus PRNT50. Linear regression analysis of the data set revealed a strong correlation (P < 0.001); as to accuracy, the r2 value was 0.56. (B) Validation of accuracy of viral protein microarray measurement of human anti-VACV antibody responses. Relationship between human anti-VACV IgG titers as quantified by standard endpoint dilution ELISA versus microarray detection (P < 0.0001; r2 = 0.78). (C) Relationship between anti-VACV IgG, measured by microarray, and neutralizing antibody titers (r2 = 0.48).
FIG. 2.
FIG. 2.
Correlation of specific antibody response targets with virus neutralization activity. IgG levels specific for individual VACV MV surface proteins were measured by vaccinia viral protein microarray analysis of plasma samples from 50 smallpox vaccine recipients. Separately, VACV neutralizing antibody levels were quantified (PRNT50) using the same plasma samples. Linear regression analysis was done to determine the presence or absence of correlation between the levels of IgG (relative units) for each individual VACV protein and neutralizing antibody titers in the cohort of vaccinees. Six known or putative MV surface proteins exhibited a positive correlation with neutralizing antibody titers. Graphs (y axis, anti-VACV protein IgG; x axis, PRNT50) are shown in order from highest to lowest correlation (r2): H3, r2 = 0.41 (A); A27, r2 = 0.25 (B); D8, r2 = 0.25 (C); A14, r2 = 0.19 (D); D13, r2 = 0.17 (E); L1, r2 = 0.12 (F). Error bars represent the full range of duplicate samples.
FIG. 3.
FIG. 3.
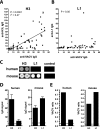
Immunodominance comparison of H3 and L1 antigens in humans and mice. (A) Anti-H3 IgG graphed against total anti-VACV IgG (VACV lysate antigen) for each of the 50 donors (individual squares). P < 0.0001; r2 = 0.47. Error bars represent teh full range of duplicate samples. (B) Anti-L1 IgG graphed against total anti-VACV IgG (VACV lysate antigen) for each of the 50 donors (P > 0.05). (C) Example microarray spots of H3 and L1 proteins probed with human and mouse plasma and serum samples. (D) Average IgG signals to H3 and L1 in human or mouse samples. An IgG signal level of 2 RU (relative units) was selected as a stringent cutoff (dashed line), establishing 98% specificity (Table 1 and Materials and Methods). (E) Ratio of anti-H3 IgG to VACV lysate IgG or anti-L1 IgG to VACV lysate IgG for vaccinated humans (left) or mice (right).
FIG. 4.
FIG. 4.
Antibody profiles of individual vaccinees. IgG responses to known and potential VACV MV surface antigens are shown for three human vaccinees (A to C) and one unvaccinated donor (D). Two negative control antigens are shown on the left side of each graph. VACV lysate was used as a positive control and is shown to the right of the dividing line, along with D13, which has uncertain surface expression. Dashed line, limit of detection. Error bars represent the full range of duplicate samples.
FIG. 5.
FIG. 5.
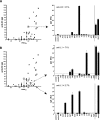
Variable anti-H3 and anti-L1 IgG responses in vaccinated humans. (A) Human vaccinee identified with a highly immunodominant IgG response to H3 among the MV surface proteins (91% of measurable anti-MV surface protein IgG). (B) Donors that likely depend on neutralizing antibodies to targets other than H3 could be identified by selecting individuals with no or low anti-H3 IgG but who nevertheless possessed significant neutralizing antibody titers (anti-H3 versus PRNT50). Other candidate neutralizing antibody targets could be assessed by examining the antibody responses to the remaining known MV surface proteins. By such analysis, a vaccinee was identified with an immunodominant anti-L1 IgG response (upper graph; anti-L1 highlighted in black). In contrast, a representative vaccinee with the same neutralizing antibody titer exhibited no detectable anti-L1 IgG (lower graph, ≤2.7% of measurable anti-MV surface protein IgG), indicating that anti-L1 IgG is not necessary for virus neutralization activity. Dashed lines, limits of detection.
FIG. 6.
FIG. 6.
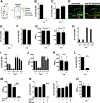
Effects of blockade of anti-H3 antibodies on virus neutralization activity of human plasma. (A to D) Plasma from a human smallpox vaccinee was blocked with the rH3 protein and tested for efficiency of the blockade, specificity of the blockade, and the effect of the blockade on VACV neutralization activity. Quantitation of anti-H3 (A) or anti-D8 (B) binding IgG in plasma after anti-H3 antibodies were blocked with rH3 (10 μg) (+) or left untreated (−). (C) Raw data from the VACV viral protein microarrays. H3 protein spots (yellow box) and D8 protein spots (red box) in untreated plasma (plasma alone) or blocked plasma (+ rH3). (D) VACV neutralizing antibody levels with or without rH3 blockade (percentage of starting level quantified). Data are representative of numerous experiments. (E) Quantitation of anti-H3 IgG binding in plasma from a vaccinee blocked with different amounts of rH3 protein (0, 0.1, 1, 10, or 50 μg). (F) Quantitation of VACV neutralizing antibody activity in the plasma samples from panel E. Data in (E and F) are representative of two experiments. (G and H) Serum from an H3 protein-immunized rabbit was incubated with 10 μg of rH3 protein (+) to block anti-H3 IgG activity and then tested for anti-H3 binding IgG (reduced 92% by blockade) (G) or VACV neutralizing antibody activity (reduced 87% by blockade) (H). (I) VACV neutralizing antibody activity measured after preincubation with 10 μg of rH3 protein or UV-VACV (107 PFU equivalent). Pooled data of samples from seven human donors are shown. (J) Percentage of VACV neutralizing antibody activity in plasma from each human donor (a to h) measured after preblocking with the rH3 protein (data using 1- or 10-μg treatment were pooled since no difference was observed between the two groups). The Error bar indicates the full data range. The red line indicates 100% of starting VACV neutralization activity in untreated plasma from each individual vaccinee. (K) Quantitation of anti-VACV-specific IgG signal intensities from VACV protein microarray ELISA probed with sera from two different smallpox vaccinees used for this figure. The error bar indicates the full data range. Dashed line, limit of detection. Error bars in panels show SEM unless otherwise indicated. Data are representative of multiple experiments.
FIG. 7.
FIG. 7.
Reverse immunoprecipitation: effects of depletion of anti-H3 antibodies on virus neutralization activity of human plasma. (A) H3-specific antibodies were depleted by conjugation of His-rH3 to Ni-Sepharose agarose (“Ni-seph”), incubation with plasma from a vaccinee, and centrifugation. Quantification of anti-H3 (B and E) or anti-D13 (C and F) IgG signal intensities from donor #1 (B and C) or donor #2 (E and F), untreated (−) or after anti-H3 antibody depletion (+). (D) Representative array scan of serum from donor #1 showing spots of H3 (yellow box) or the control (VACV lysate, red box) in untreated serum (whole plasma) or anti-H3 antibody-depleted serum with 10 μg of rH3 (H3-depleted plasma). (G) VACV neutralizing antibody titers (PRNT50) in smallpox-vaccinated donors #1 and 2 measured before (−) and after (+) anti-H3 antibody depletion. Data are representative of multiple experiments. (H to J) Depletion of H3-specific antibodies in samples from four total vaccinees (a to d). Quantification of anti-H3 (H) or anti-D8 (I) IgG in each human donor (a to d) measured before (−) and after (+) anti-H3 antibody depletion. (J) VACV neutralizing antibody titers (PRNT50) in each human donor (a to d) measured before (−) and after (+) anti-H3 antibody depletion. (K) VACV neutralizing antibody titers (PRNT50) in VACV-infected mice measured before (−) and after (+) anti-H3 antibody depletion. Quantification of anti-H3 (L) or VACV neutralizing (M) antibody titers (PRNT50) in H3 protein-immunized rabbits measured before (−) and after (+) anti-H3 antibody depletion. Ni-Sepharose-alone control is shown. (N) Quantitation of anti-H3 and anti-D13 IgG when the order of the anti-H3 IgG depletion was reversed. Plasma was preincubated with His-tagged rH3 and then complexed with Ni-Sepharose. Samples were untreated, treated with Ni-Sepharose alone, or depleted using one of two His-tagged VACV proteins: rH3 or WR148. (O) VACV neutralizing antibody titers (PRNT50) measured in plasma samples from panel N, pretreated as indicated. All data are representative of multiple experiments. Error bars indicate SEM in each condition, except in panel I, where error bars represent the full data range of replicate samples.
FIG. 8.
FIG. 8.
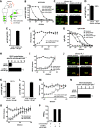
Affinity purification of human anti-H3 antibodies from smallpox vaccinees. Antiviral antibodies from human smallpox vaccinee donor #1 (B to I) and donor #2 (J to P) were examined after depletion or purification of anti-H3 Ig using affinity column chromatography. (A) Anti-H3 IgG was purified from human plasma by rH3 affinity chromatography. Column flowthrough fractions were collected, as were wash fractions. Anti-H3 IgG was eluted by a low-pH wash (“eluted anti-H3 IgG”). (B) Anti-H3 IgG in fractions was quantified by H3 ELISA. Plasma from an unvaccinated donor was used as a negative control. (C) Raw microarray data; H3 protein (yellow box) and control (total VACV lysate, red box). (D) Quantitation of depletion of anti-H3 IgG from the plasma sample, determined by VACV protein microarray ELISA. (E) Quantitation of purification of anti-H3 IgG, as per panel D. (F) VACV neutralizing antibody activity of purified human anti-H3 IgG from donor #1, determined by serial dilution. Plaque assay results are graphed. The affinity column wash fraction was used as a negative control. (G) Absolute concentrations of IgG in samples were determined by ELISA, using an IgG standard (open squares). (H) VACV neutralization specific activity (μg/ml IgG necessary to neutralize 50% of VACV PFU; reciprocal value shown for ease of visualization) calculated for whole plasma and purified anti-H3 IgG from smallpox vaccinated donor #1. (I) VACV neutralizing antibody activity of anti-H3-depleted plasma (“flow through”) and untreated plasma (“whole plasma”) samples from donor #1, determined by serial dilution. Plaque assay results are graphed. The column wash fraction was used as a negative control (experiment done concurrently with that shown in panel F). (J) VACV protein microarray ELISA scan of affinity column samples from donor #2. Spots of the H3 protein (yellow box) and control (total VACV lysate, red box) are highlighted. Anti-H3 IgG levels quantified in whole plasma and flowthrough fractions (K) or wash fractions (L) versus eluted anti-H3 IgG. (M) VACV neutralizing antibody activity. (N) Specific activity of purified human anti-H3 IgG from donor #2. (O) VACV neutralizing antibody activity of anti-H3-depleted plasma (“flow through”) and untreated plasma (“whole plasma”) samples from donor #2, determined by serial dilution. Plaque assay results are graphed. (P) VACV neutralization activity (PRNT50) determined for purified anti-H3 IgG, plasma from an unvaccinated donor, and a mixture of the two. All data are representative of multiple experiments. Error bars indicate SEM in each condition.
FIG. 9.
FIG. 9.
Blocking or depleting human anti-L1 IgG. (A) Anti-L1 IgG graphed against total anti-VACV IgG, reproduced from Fig. 3B, with donor of interest circled. (B and C) Plasma blocked with the rL1 protein (10 μg) and tested for efficiency and specificity of the blockade. (C) Raw microarray data. L1 protein spots (yellow box) and whole VACV lysate spots (red box) in untreated plasma (plasma alone) or blocked plasma (+ rL1). (D) VACV neutralizing antibody levels with or without rL1 blockade (percentage of starting level). Error bar indicates SEM for each condition. Data are representative of numerous experiments. (E) Percentage of VACV neutralizing antibody activity for each of five L1 seropositive human donors (a to e) measured in plasma samples after preblocking with the rL1 protein. The red line indicates 100% of starting VACV neutralization activity in untreated plasma from each individual vaccinee. (F) Data averaged for all six donors tested. (G) Quantitation of VACV neutralizing antibody activity in plasma samples from a smallpox vaccinee preblocked with different amounts of the rL1 protein (0, 1, 10, and 50 μg). (H) VACV neutralizing antibody activity (percentage of initial level) in VACV-infected mice measured before (−) and after (+) anti-L1 blockade. (I) Depletion of anti-L1 IgG from the plasma of smallpox vaccine-immunized humans by reverse immunoprecipitation (Ni-Sepharose plus His-rL1 plus plasma). (J) VACV neutralizing antibody titers (PRNT50) measured before (−) and after (+) anti-L1 antibody depletion. (K) Depletion of anti-L1 IgG from the plasma of a vaccinee by reverse immunoprecipitation, with the binding order changed (His-rL1 plus plasma plus Ni-Sepharose). (L) VACV neutralizing antibody titers (PRNT50) measured before (−) and after (+) anti-L1 antibody depletion in panel K. (M) Average VACV neutralizing antibody activity (percentage of initial level) for nine H3- and L1-seropositive human donors, measured in plasma samples before (−) and after (+) combined blocking with 10 μg of the rH3 and rL1 proteins. (N) VACV neutralizing antibody activity (percentage of initial level) in VACV-infected mice measured before (−) and after (+) anti-H3 and -L1 combined blockade. Each data set is representative of multiple experiments. Error bars indicate SEM for each condition.
FIG. 10.
FIG. 10.
Affinity purification of human anti-L1 antibodies from smallpox vaccinees. Antiviral antibodies from human smallpox vaccinee donor #3 (A to G) or donor #4 (H to O) were examined after depletion or purification of anti-L1 IgG using affinity column chromatography. Anti-L1 IgG in fractions was quantified by L1 ELISA (A) or protein microarray ELISA (B and C). (B) Specificity of the depletion and purification of anti-L1 IgG from the plasma sample was determined by VACV protein microarray ELISA. (C) Raw microarray data showing the L1 protein (yellow box) and positive control (total VACV lysate, red box). (D) VACV neutralizing antibody activity of purified human anti-L1 IgG. (E) Absolute concentrations of IgG in fractions were determined by IgG ELISA, using an IgG standard (open squares). (F) VACV neutralization-specific activity. (G) VACV neutralizing antibody activity of anti-L1-depleted plasma (“flow through”) or untreated plasma (“whole plasma”). (H to O) Anti-L1 purification and analysis from donor #4. (H) L1 ELISA. (I) Protein microarray data, as per panel C. (J) Anti-L1 IgG levels were quantified in whole plasma and flowthrough fractions (left) or in wash fractions versus eluted anti-L1 IgG (right). (K) VACV neutralizing antibody activity of purified human anti-L1 IgG. (L) Human IgG ELISA. (M) VACV neutralization-specific activity of purified anti-L1 IgG from donor #4. (N) VACV neutralizing antibody activity of anti-L1-depleted plasma (“flow through”) and untreated plasma (“whole plasma”) samples from donor #4. (O) VACV neutralizing antibody titers (PRNT50) determined for samples from human smallpox vaccinee donor #3 and donor #4 using whole plasma (precolumn [Pre]) or anti-L1-depleted plasma (postcolumn [Post]). All data are representative of multiple experiments. Error bars indicate SEM for each condition.
FIG. 11.
FIG. 11.
VIG: IgG specific to known and potential VACV MV surface antigens. Two negative control antigens are shown (leftmost columns). VACV lysate was used as a positive control. Responses to VACV antigens WR148 and I1 are also shown. Dashed line, limit of detection. Error bars represent the full range of duplicate samples.

References

    1. Aldaz-Carroll, L., J. C. Whitbeck, M. Ponce de Leon, H. Lou, L. Hirao, S. N. Isaacs, B. Moss, R. J. Eisenberg, and G. H. Cohen. 2005. Epitope-mapping studies define two major neutralization sites on the vaccinia virus extracellular enveloped virus glycoprotein B5R. J. Virol. 796260-6271. - PMC - PubMed
    1. Aldaz-Carroll, L., J. C. Whitbeck, M. Ponce de Leon, H. Lou, L. K. Pannell, J. Lebowitz, C. Fogg, C. L. White, B. Moss, G. H. Cohen, and R. J. Eisenberg. 2005. Physical and immunological characterization of a recombinant secreted form of the membrane protein encoded by the vaccinia virus L1R gene. Virology 34159-71. - PubMed
    1. Alibek, K. 27 March 1998. Russia's deadly expertise, p. A19. In The New York Times. The New York Times Co., New York, NY.
    1. Alibek, K., and S. Handelman. 1999. Biohazard. Random House, New York, NY.
    1. Amanna, I. J., M. K. Slifka, and S. Crotty. 2006. Immunity and immunological memory following smallpox vaccination. Immunol. Rev. 211320-337. - PubMed

Publication types