

Gamma oscillations and spontaneous network activity in the hippocampus are highly sensitive to decreases in pO2 and concomitant changes in mitochondrial redox state
- PMID: 18234893
- PMCID: PMC6671409
- DOI: 10.1523/JNEUROSCI.4105-07.2008
Gamma oscillations and spontaneous network activity in the hippocampus are highly sensitive to decreases in pO2 and concomitant changes in mitochondrial redox state
Abstract
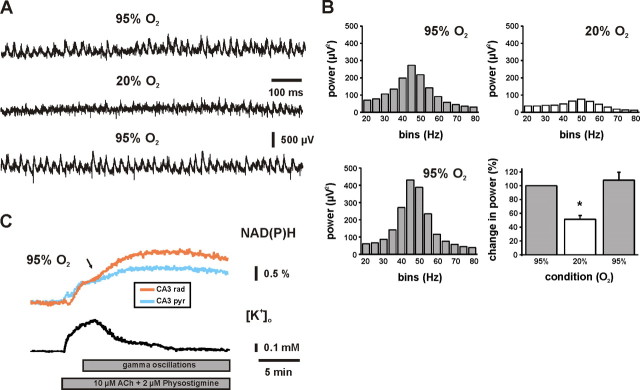
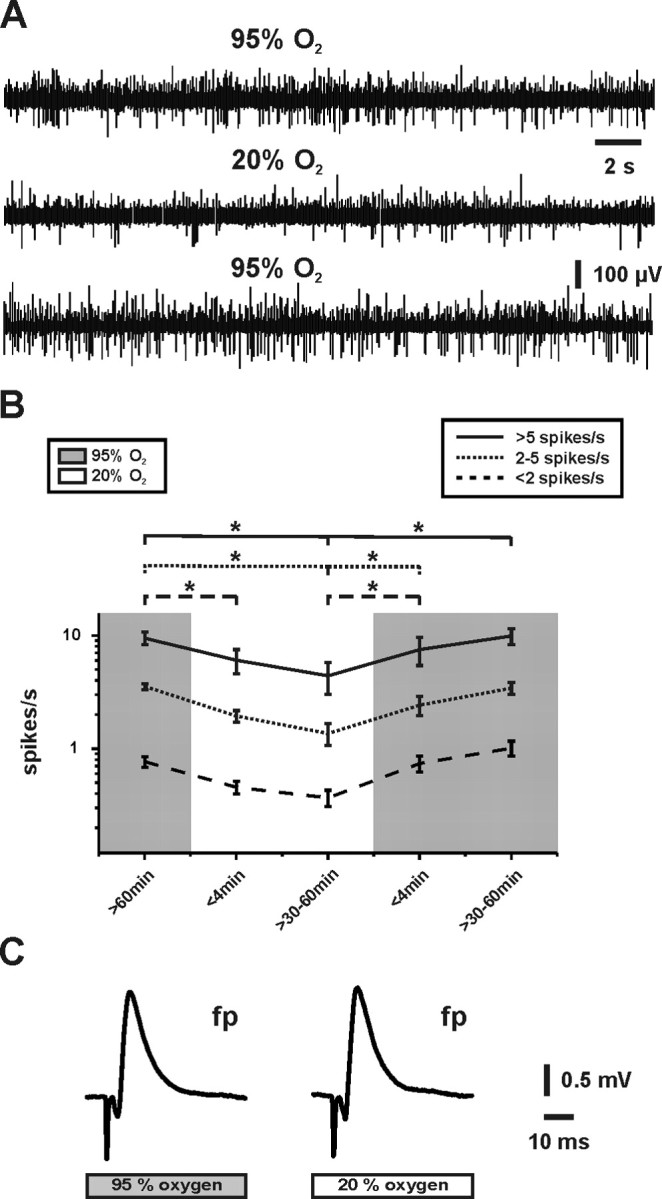
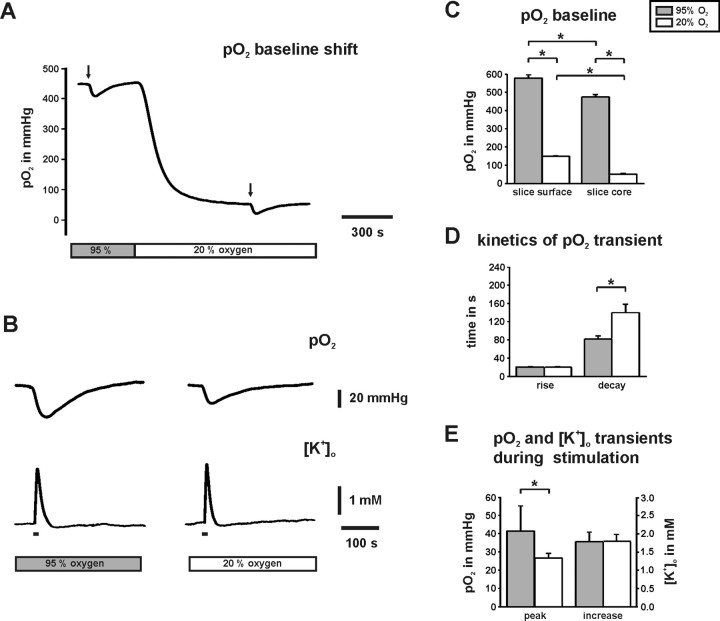
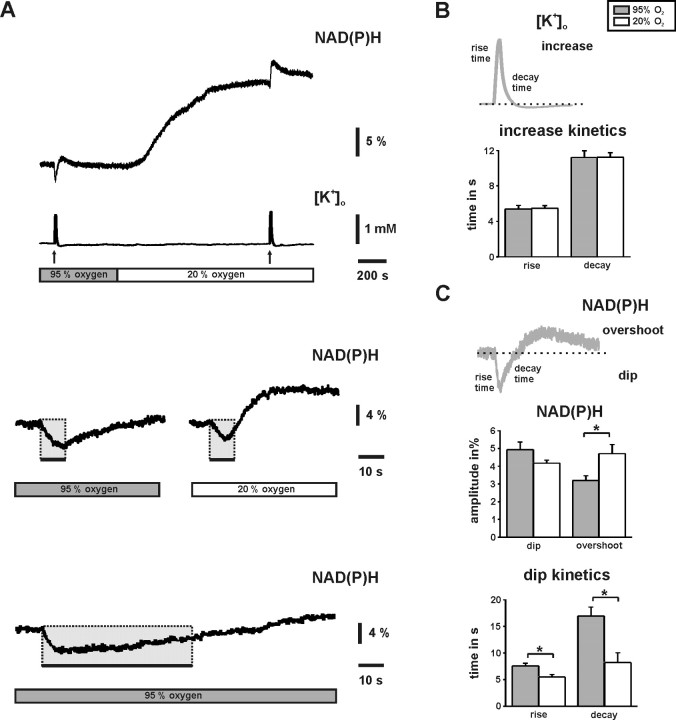
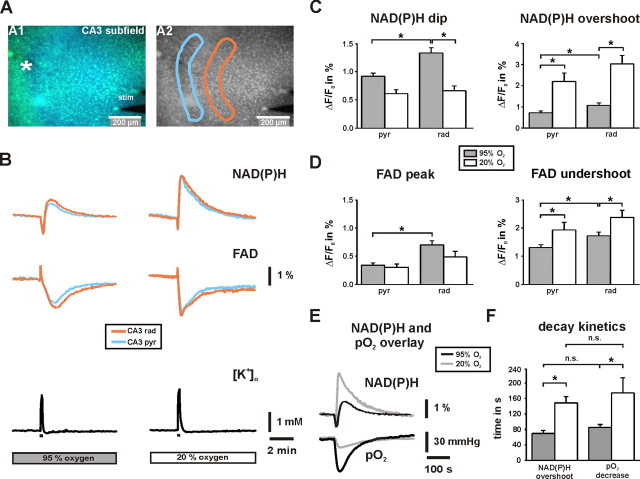
Gamma oscillations have been implicated in higher cognitive processes and might critically depend on proper mitochondrial function. Using electrophysiology, oxygen sensor microelectrode, and imaging techniques, we investigated the interactions of neuronal activity, interstitial pO2, and mitochondrial redox state [NAD(P)H and FAD (flavin adenine dinucleotide) fluorescence] in the CA3 subfield of organotypic hippocampal slice cultures. We find that gamma oscillations and spontaneous network activity decrease significantly at pO2 levels that do not affect neuronal population responses as elicited by moderate electrical stimuli. Moreover, pO2 and mitochondrial redox states are tightly coupled, and electrical stimuli reveal transient alterations of redox responses when pO2 decreases within the normoxic range. Finally, evoked redox responses are distinct in somatic and synaptic neuronal compartments and show different sensitivity to changes in pO2. We conclude that the threshold of interstitial pO2 for robust CA3 network activities and required mitochondrial function is clearly above the "critical" value, which causes spreading depression as a result of generalized energy failure. Our study highlights the importance of a functional understanding of mitochondria and their implications on activities of individual neurons and neuronal networks.
Figures
Similar articles
-
Gamma oscillations in the hippocampus require high complex I gene expression and strong functional performance of mitochondria.Brain. 2011 Feb;134(Pt 2):345-58. doi: 10.1093/brain/awq333. Epub 2010 Dec 22. Brain. 2011. PMID: 21183487
-
Oxygen consumption rates during three different neuronal activity states in the hippocampal CA3 network.J Cereb Blood Flow Metab. 2013 Feb;33(2):263-71. doi: 10.1038/jcbfm.2012.165. Epub 2012 Nov 21. J Cereb Blood Flow Metab. 2013. PMID: 23168532 Free PMC article.
-
Simultaneous monitoring of tissue PO2 and NADH fluorescence during synaptic stimulation and spreading depression reveals a transient dissociation between oxygen utilization and mitochondrial redox state in rat hippocampal slices.J Cereb Blood Flow Metab. 2011 Feb;31(2):626-39. doi: 10.1038/jcbfm.2010.136. Epub 2010 Aug 25. J Cereb Blood Flow Metab. 2011. PMID: 20736960 Free PMC article.
-
Cellular mechanisms of neuronal population oscillations in the hippocampus in vitro.Annu Rev Neurosci. 2004;27:247-78. doi: 10.1146/annurev.neuro.27.070203.144303. Annu Rev Neurosci. 2004. PMID: 15217333 Review.
-
Network mechanisms of gamma oscillations in the CA3 region of the hippocampus.Neural Netw. 2009 Oct;22(8):1113-9. doi: 10.1016/j.neunet.2009.07.024. Epub 2009 Jul 22. Neural Netw. 2009. PMID: 19683412 Review.
Cited by
-
Critical state of energy metabolism in brain slices: the principal role of oxygen delivery and energy substrates in shaping neuronal activity.Front Neuroenergetics. 2011 Dec 29;3:9. doi: 10.3389/fnene.2011.00009. eCollection 2011. Front Neuroenergetics. 2011. PMID: 22232599 Free PMC article.
-
Energy and Potassium Ion Homeostasis during Gamma Oscillations.Front Mol Neurosci. 2016 Jun 16;9:47. doi: 10.3389/fnmol.2016.00047. eCollection 2016. Front Mol Neurosci. 2016. PMID: 27378847 Free PMC article. Review.
-
Glycolysis and oxidative phosphorylation in neurons and astrocytes during network activity in hippocampal slices.J Cereb Blood Flow Metab. 2014 Mar;34(3):397-407. doi: 10.1038/jcbfm.2013.222. Epub 2013 Dec 11. J Cereb Blood Flow Metab. 2014. PMID: 24326389 Free PMC article.
-
Experimental cortical stroke induces aberrant increase of sharp-wave-associated ripples in the hippocampus and disrupts cortico-hippocampal communication.J Cereb Blood Flow Metab. 2020 Sep;40(9):1778-1796. doi: 10.1177/0271678X19877889. Epub 2019 Sep 26. J Cereb Blood Flow Metab. 2020. PMID: 31558106 Free PMC article.
-
Cerebral oxygenation during locomotion is modulated by respiration.Nat Commun. 2019 Dec 4;10(1):5515. doi: 10.1038/s41467-019-13523-5. Nat Commun. 2019. PMID: 31797933 Free PMC article.
References
-
- Ances BM, Buerk DG, Greenberg JH, Detre JA. Temporal dynamics of the partial pressure of brain tissue oxygen during functional forepaw stimulation in rats. Neurosci Lett. 2001;306:106–110. - PubMed
-
- Andrews ZB, Diano S, Horvath TL. Mitochondrial uncoupling proteins in the CNS: in support of function and survival. Nat Rev Neurosci. 2005;6:829–840. - PubMed
-
- Attwell D, Iadecola C. The neural basis of functional brain imaging signals. Trends Neurosci. 2002;25:621–625. - PubMed
Publication types
MeSH terms
LinkOut - more resources
Full Text Sources
Miscellaneous