

Dysregulated chemokine receptor expression and chemokine-mediated cell trafficking in pediatric patients with ESRD
- PMID: 18235145
- PMCID: PMC2390942
- DOI: 10.2215/CJN.00120107
Dysregulated chemokine receptor expression and chemokine-mediated cell trafficking in pediatric patients with ESRD
Abstract
Background and objectives: Children and adolescents with ESRD on dialysis are susceptible to serious bacterial infections (SBI). Chemokines and chemokine receptors play a critical role in modulating macrophage and neutrophil function. This study examined the hypothesis that expression and/or function of these molecules is dysregulated in patients with ESRD, contributing to leukocyte dysfunction. Design setting, participants, & measurements: Pediatric patients, age 6 mo to 18 yr, with ESRD treated with either hemodialysis or peritoneal dialysis were enrolled in this prospective, nontherapeutic study. Blood was collected for plasma chemokine levels, chemokine receptor profiling by flow cytometry, and functional chemotaxis studies on neutrophils and mononuclear cells.
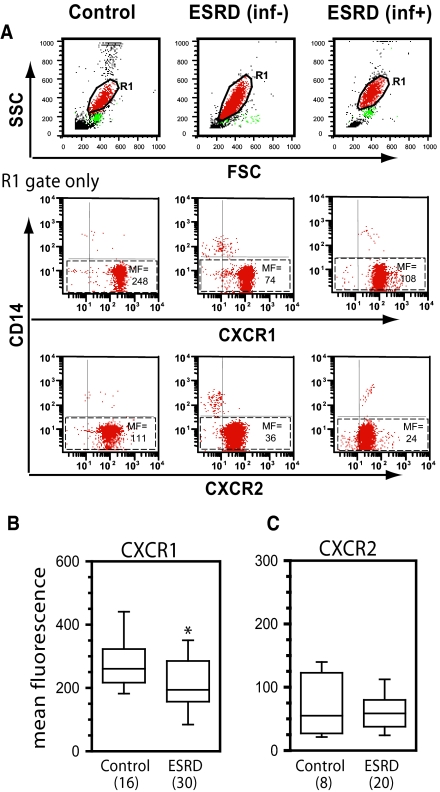
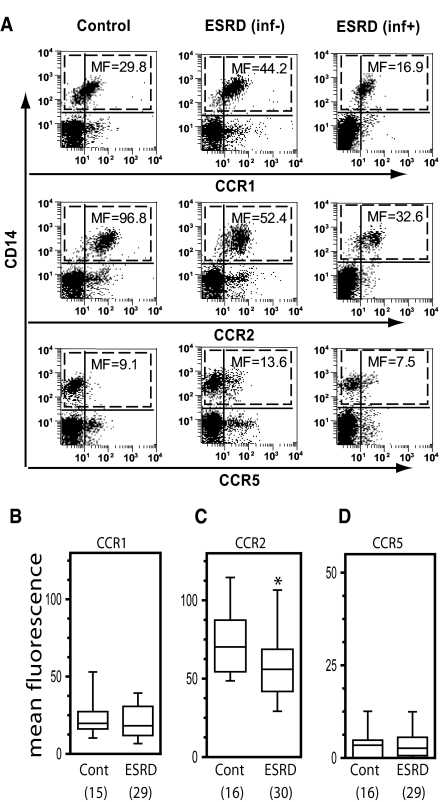
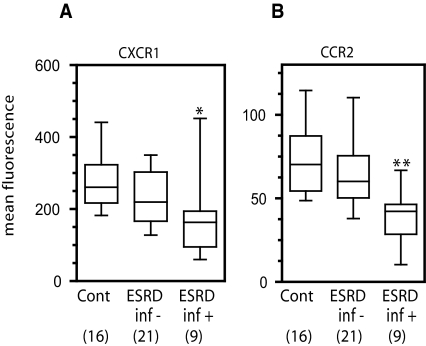
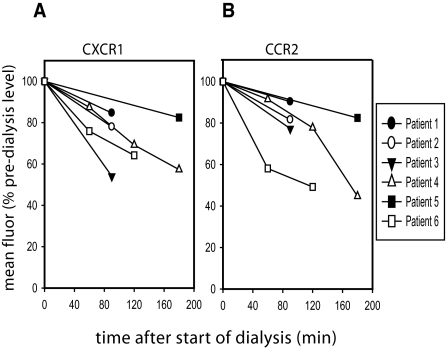
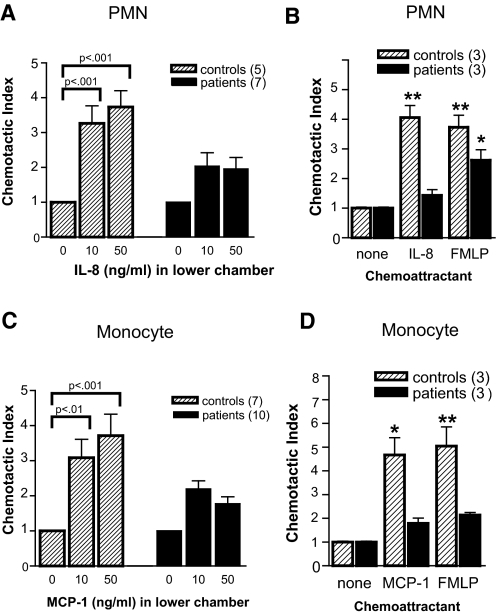
Results: ESRD in children was associated with reduced expression of the chemokine receptors CXCR1 and chemokine (C-C motif) receptor 2 (CCR2) on circulating neutrophils and monocytes, respectively. When ESRD patients were divided into two subgroups, those who were infection-free and those who had three or more SBI in the preceding year, the differences in chemokine receptor expression were statistically significant compared with control subjects only in those with recurrent infection. In addition to the effects of ESRD on baseline chemokine receptor expression, the hemodialysis procedure itself acutely lowered neutrophil CXCR1 and monocyte CCR2 expression. Furthermore, neutrophil and monocyte responsiveness to chemokine-mediated trafficking signals was impaired in all ESRD patients studied. This abnormality was independent of the level of chemokine receptor expression on the leukocytes.
Conclusions: The data presented in this study suggest that chemokine receptor dysregulation contributes to leukocyte dysfunction in patients with ESRD. This alteration is especially prominent in ESRD patients with recurrent infection.
Figures
Similar articles
-
Neutrophil and monocyte activation in chronic kidney disease patients under hemodialysis and its relationship with resistance to recombinant human erythropoietin and to the hemodialysis procedure.Hemodial Int. 2010 Jul;14(3):295-301. doi: 10.1111/j.1542-4758.2010.00450.x. Hemodial Int. 2010. PMID: 20649681
-
CXC-chemokine stimulation of neutrophils correlates with plasma levels of myeloperoxidase and lactoferrin and contributes to clinical outcome after pediatric cardiac surgery.Shock. 2004 Dec;22(6):513-20. doi: 10.1097/01.shk.0000145939.54838.51. Shock. 2004. PMID: 15545821 Clinical Trial.
-
Subsets of myeloid-derived suppressor cells in hepatocellular carcinoma express chemokines and chemokine receptors differentially.Int Immunopharmacol. 2015 Jun;26(2):314-21. doi: 10.1016/j.intimp.2015.04.010. Epub 2015 Apr 16. Int Immunopharmacol. 2015. PMID: 25891236
-
A novel flow cytometric assay of human whole blood neutrophil and monocyte CD11b levels: upregulation by chemokines is related to receptor expression, comparison with neutrophil shape change, and effects of a chemokine receptor (CXCR2) antagonist.Pulm Pharmacol Ther. 2007;20(1):52-9. doi: 10.1016/j.pupt.2005.11.009. Epub 2006 Jan 6. Pulm Pharmacol Ther. 2007. PMID: 16406722
-
MCP-1 and CCR2 in HIV infection: regulation of agonist and receptor expression.J Leukoc Biol. 1997 Jul;62(1):30-3. doi: 10.1002/jlb.62.1.30. J Leukoc Biol. 1997. PMID: 9225989 Review.
Cited by
-
Expression of chemokine receptors on peripheral blood T cells in children with chronic kidney disease.Mediators Inflamm. 2015;2015:536894. doi: 10.1155/2015/536894. Epub 2015 Mar 18. Mediators Inflamm. 2015. PMID: 25866451 Free PMC article.
-
Hemodialysis-related changes in phenotypical features of monocytes.Sci Rep. 2018 Sep 18;8(1):13964. doi: 10.1038/s41598-018-31889-2. Sci Rep. 2018. PMID: 30228352 Free PMC article.
-
Regulation of Staphylococcus aureus-induced CXCR1 expression via inhibition of receptor mobilization and receptor shedding during dual receptor (TNFR1 and IL-1R) neutralization.Immunol Res. 2019 Jun;67(2-3):241-260. doi: 10.1007/s12026-019-09083-x. Immunol Res. 2019. PMID: 31290001
-
Sepsis and AKI: more complex than just a simple question of chicken and egg.Intensive Care Med. 2011 Feb;37(2):186-9. doi: 10.1007/s00134-010-2097-9. Epub 2010 Dec 9. Intensive Care Med. 2011. PMID: 21152897 No abstract available.
-
Neutrophil chemoattractant receptors in health and disease: double-edged swords.Cell Mol Immunol. 2020 May;17(5):433-450. doi: 10.1038/s41423-020-0412-0. Epub 2020 Apr 1. Cell Mol Immunol. 2020. PMID: 32238918 Free PMC article. Review.
References
-
- Marr KA, Kong L, Fowler VG, Gopal A, Sexton DJ, Conlon PJ, Corey GR: Incidence and outcome of Staphylococcus aureus bacteremia in hemodialysis patients. Kidney Int 54: 1684–1689, 1998 - PubMed
-
- Liangos O, Gul A, Madias NE, Jaber BL: Long-term management of the tunneled venous catheter. Semin Dial 19: 158–164, 2006 - PubMed
-
- Beathard GA: Management of bacteremia associated with tunneled-cuffed hemodialysis catheters. J Am Soc Nephrol 10: 1045–1049, 1999 - PubMed
-
- Tanriover B, Carlton D, Saddekni S, Hamrick K, Oser R, Westfall AO, Allon M: Bacteremia associated with tunneled dialysis catheters: Comparison of two treatment strategies. Kidney Int 57: 2151–2155, 2000 - PubMed
-
- Bunke CM, Brier ME, Golper TA: Outcomes of single organism peritonitis in peritoneal dialysis: Gram negatives versus gram positives in the Network 9 Peritonitis Study. Kidney Int 52: 524–529, 1997 - PubMed
Publication types
MeSH terms
Substances
Grants and funding
LinkOut - more resources
Full Text Sources
Medical
