. 2008 Mar;7(3):1109-17.
doi: 10.1021/pr700702r. Epub 2008 Feb 1.

Profiling of human serum glycans associated with liver cancer and cirrhosis by IMS-MS

Affiliations

Profiling of human serum glycans associated with liver cancer and cirrhosis by IMS-MS

D Isailovic et al. J Proteome Res. 2008 Mar.

Abstract

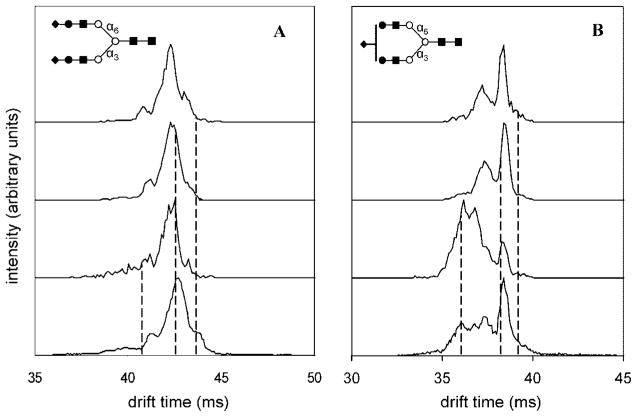
Aberrant glycosylation of human glycoproteins is related to various physiological states, including the onset of diseases such as cancer. Consequently, the search for glycans that could be markers of diseases or targets of therapeutic drugs has been intensive. Here, we describe a high-throughput ion mobility spectrometry/mass spectrometry analysis of N-linked glycans from human serum. Distributions of glycans are assigned according to their m/z values, while ion mobility distributions provide information about glycan conformational and isomeric composition. Statistical analysis of data from 22 apparently healthy control patients and 39 individuals with known diseases (20 with cirrhosis of the liver and 19 with liver cancer) shows that ion mobility distributions for individual m/z ions appear to be sufficient to distinguish patients with liver cancer or cirrhosis. Measurements of glycan conformational and isomeric distributions by IMS-MS may provide insight that is valuable for detecting and characterizing disease states.


Figures

Figure 1
Figure 1
Schematic diagram of the NanoMate-IMS-TOF instrument.
Figure 2
Figure 2
Two-dimensional tD(m/z) plot of mobility-dispersed glycan ions originating from human serum. Glycan structures were assigned by comparison of measured m/z values with m/z values cited in the literature. S represents sialic acid, H represents a hexose (galactose or mannose), and N represents N-acetyl glucosamine. In cartoon images, solid squares represent N-acetyl glucosamine, open circles represent mannose, solid circles represent galactose, and diamonds represent sialic acid. Two structural isomers of S1H5N4 have sialic acid added to the antenna either on the α-1,3-linked mannose residues or α-1,6-linked mannose residues.
Figure 3
Figure 3
Overlap of normalized total mass spectra for a set (three samples) of glycans isolated from human serum of a patient with liver cancer (bottom), a healthy patient (middle), and a patient with a liver cirrhosis (top). Glycan structures were assigned by comparison of measured m/z values with m/z values of glycans found in the literature, and the assignment is shown on the top of the plot. S represents sialic acid, H represents hexose (mannose or galactose), N represents N-acetyl glucosamine, and F represents fucose.
Figure 4
Figure 4
(A) PCA of drift time profiles for glycan [S1H5N4 + 3Na]3+ (m/z = 826.0). (B) PCA of drift time profiles for glycan [S2H5N4 + 3Na]3+ (m/z = 946.7). Both analyses were done a total of 61 samples, that is, 19 glycan samples from serum of patients with liver cancer (HC samples, green circles), 22 glycan samples from healthy patients (NC-samples, red squares), and 21 glycan sample from patients with liver disease cirrhosis (QT-samples, purple triangles).
Figure 5
Figure 5
(A) Probing conformational changes of glycan isomers by IMS-IMS–MS. Precursor and mobility selected drift time distributions for [S2H5N4 + 3Na]3+ (m/z = 946.7) at three different selection times (shown by dashed lines). The drift time distributions for mobility selected precursors are obtained after gentle activation of ions at IA2. (B) Probing conformational changes of isomers by IMS-IMS–MS (continued). Precursor and mobility selected drift time distributions for [S1H5N4 + 3Na]3+ (m/z = 826.0) at three different selection times (shown by dashed lines). The drift time distributions for mobility selected precursors are obtained after gentle activation of ions at IA2. Selections made for low mobility precursors are dominated by similar features with an identical distribution after ion activation indicating presence of one isomer. High-mobility region is dominated by features that do not show similar distribution upon ion activation indicating presence of another isomer.

Similar articles

Cited by

References

    1. Hanash S. Nature. 2003;422:226–232. - PubMed
    1. Anderson NL, Anderson NG. Mol Cell Proteomics. 2002;1:845–867. - PubMed
    1. Aebersold R, Mann M. Nature. 2003;422:198–207. - PubMed
    2. Domon B, Aebersold R. Science. 2006;322:212–217. - PubMed
    3. Merenbloom SI, Koeniger SL, Bohrer BC, Valentine SJ, Clemmer DE. Anal Chem. 2007 submitted for publication. - PMC - PubMed
    1. Valentine SJ, Counterman AE, Hoaglund CS, Reilly JP, Clemmer DE. J Am Soc Mass Spectrom. 1998;9:1213–1216. - PubMed
    2. Henderson SC, Valentine SJ, Counterman AE, Clemmer DE. Anal Chem. 1999;71:291–301. - PubMed
    3. Ruotolo BT, Gillig KJ, Stone EG, Russell DH. J Chromatogr, B. 2002;782:385–392. - PubMed
    4. Steiner WE, Clowers BH, English WA, Hill HH. Rapid Commun Mass Spectrom. 2004;18:882–888. - PubMed
    5. Moon MH, Myung S, Plasencia MD, Hilderbrand AE, Clemmer DE. J Proteome Res. 2003;2:589–597. - PubMed
    6. Valentine SJ, Liu X, Plasencia MD, Hilderbrand AE, Kurulugama RT, Koeniger SL, Clemmer DE. Expert Rev Proteomics. 2005;2:553–565. - PubMed
    1. Clemmer DE, Jarrold MF. J Mass Spectrom. 1997;32:577–592.

Publication types

Substances