

Microarray analysis in B cells among siblings with/without MS - role for transcription factor TCF2
- PMID: 18237449
- PMCID: PMC2227948
- DOI: 10.1186/1755-8794-1-2
Microarray analysis in B cells among siblings with/without MS - role for transcription factor TCF2
Abstract
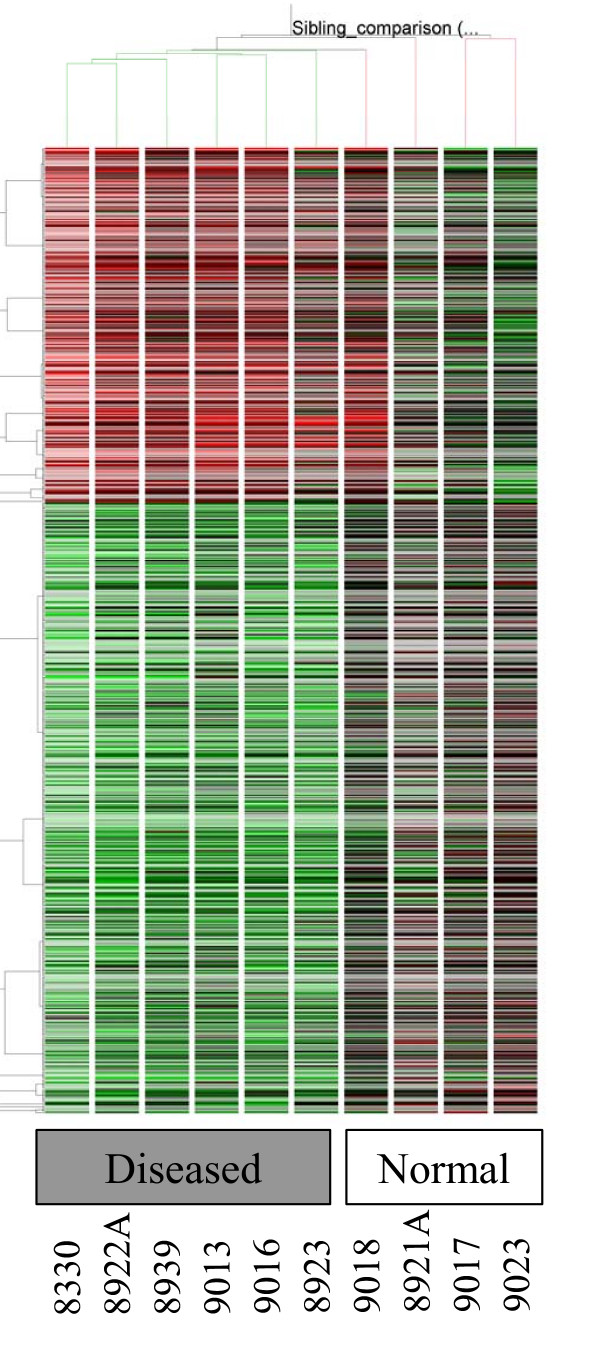
Background: We investigated if global gene expression and transcription networks in B-lymphocytes of siblings with multiple sclerosis (MS) were different from healthy siblings.
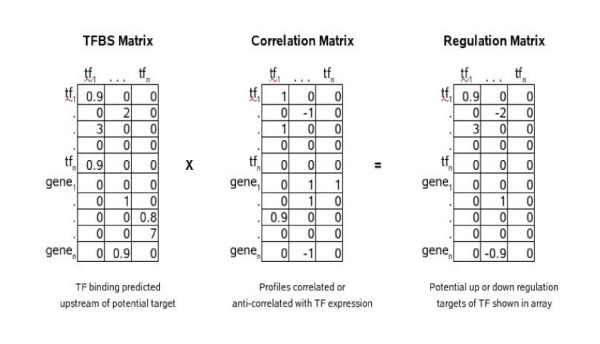
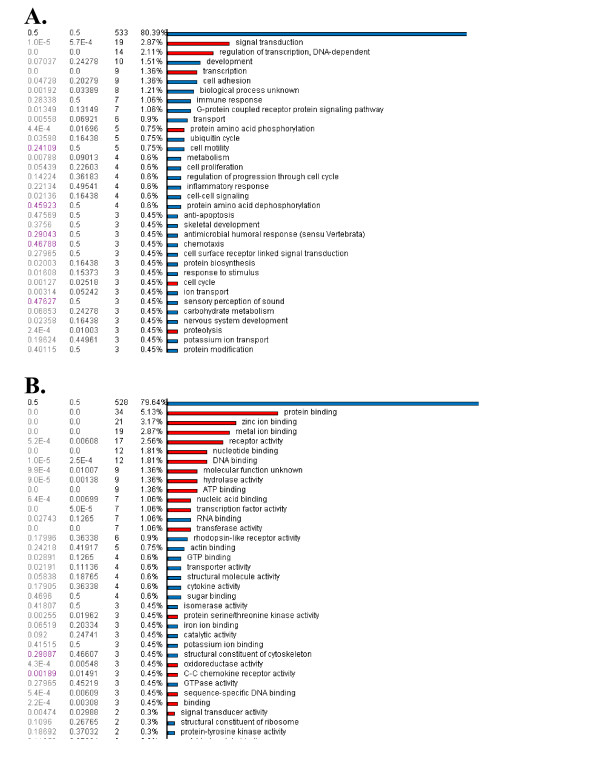
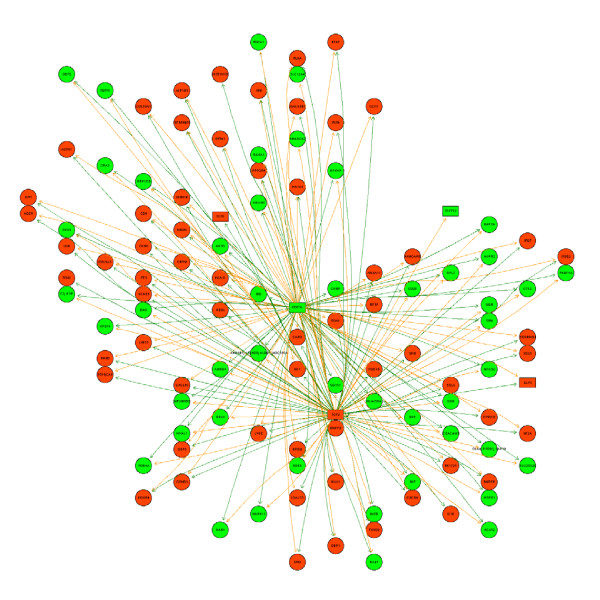
Results: Using virus-transformed immortalized B cells and human whole genome bioarrays with validation using RT-qPCR, we found that in siblings with MS, genes for CXCL10, serpin B1 and FUT4 were up regulated whereas CDC5L, TNFRSF19 and HLA-DR were down regulated, among others; transcription analysis showed two intersecting clusters of transcriptional factors - the larger, governed by the upregulated transcription factor 2 (TCF2) and the smaller network regulated by the downregulated CDC5L.
Conclusion: No study has linked TCF2 to MS and to better understand the role of TCF2 in MS, studies in larger cohorts are required.
Figures
Similar articles
-
Multiple sclerosis immunopathic trait and HLA-DR(2)15 as independent risk factors in multiple sclerosis.Mult Scler. 2007 May;13(4):441-5. doi: 10.1177/1352458506070264. Mult Scler. 2007. PMID: 17463066
-
Lack of TCF2/vHNF1 in mice leads to pancreas agenesis.Proc Natl Acad Sci U S A. 2005 Feb 1;102(5):1490-5. doi: 10.1073/pnas.0405776102. Epub 2005 Jan 24. Proc Natl Acad Sci U S A. 2005. PMID: 15668393 Free PMC article.
-
Global gene expression changes in BV2 microglial cell line during rabies virus infection.Infect Genet Evol. 2013 Dec;20:257-69. doi: 10.1016/j.meegid.2013.09.016. Epub 2013 Sep 20. Infect Genet Evol. 2013. PMID: 24056016
-
Gene expression profiles in Finnish twins with multiple sclerosis.BMC Med Genet. 2006 Feb 27;7:11. doi: 10.1186/1471-2350-7-11. BMC Med Genet. 2006. PMID: 16504146 Free PMC article.
-
[Abnormalities of hepatocyte nuclear factor (HNF)-1beta: biological mechanisms, phenotypes, and clinical consequences].Arch Pediatr. 2009 Jul;16(7):1049-56. doi: 10.1016/j.arcped.2009.02.023. Epub 2009 Apr 9. Arch Pediatr. 2009. PMID: 19361964 Review. French.
Cited by
-
Variants of genes encoding TNF receptors and ligands and proteins regulating TNF activation in familial multiple sclerosis.CNS Neurosci Ther. 2020 Nov;26(11):1178-1184. doi: 10.1111/cns.13456. Epub 2020 Sep 20. CNS Neurosci Ther. 2020. PMID: 32951330 Free PMC article.
-
Systematic review of genome-wide expression studies in multiple sclerosis.BMJ Open. 2011 Jul 18;1(1):e000053. doi: 10.1136/bmjopen-2011-000053. BMJ Open. 2011. PMID: 22021740 Free PMC article.
-
A transcription factor map as revealed by a genome-wide gene expression analysis of whole-blood mRNA transcriptome in multiple sclerosis.PLoS One. 2010 Dec 1;5(12):e14176. doi: 10.1371/journal.pone.0014176. PLoS One. 2010. PMID: 21152067 Free PMC article.
-
Alternative splicing and transcriptome profiling of experimental autoimmune encephalomyelitis using genome-wide exon arrays.PLoS One. 2009 Nov 10;4(11):e7773. doi: 10.1371/journal.pone.0007773. PLoS One. 2009. PMID: 19915720 Free PMC article.
-
Imine reductases: a comparison of glutamate dehydrogenase to ketimine reductases in the brain.Neurochem Res. 2014;39(3):527-41. doi: 10.1007/s11064-012-0964-1. Epub 2013 Jan 12. Neurochem Res. 2014. PMID: 23314864 Free PMC article. Review.
References
-
- Lindsey JW. Familial recurrence rates and genetic models of multiple sclerosis. Am J Med Genet A. 2005;135:53–8. - PubMed
-
- Ebers GC, Bulman DE, Sadovnick AD, Paty DW, Warren S, Hader W, Murray TJ, Seland TP, Duquette P, Grey T, et al. A population-based study of multiple sclerosis in twins. N Engl J Med. 1986;315:1638–42. - PubMed
-
- Mackay RP, Myrianthopoulos NC. Multiple sclerosis in twins and their relatives. Arch Neurol. 1966;15:449–62. - PubMed
LinkOut - more resources
Full Text Sources
Molecular Biology Databases
Research Materials
