

The ATPase cycle mechanism of the DEAD-box rRNA helicase, DbpA
- PMID: 18237742
- PMCID: PMC2359651
- DOI: 10.1016/j.jmb.2007.12.046
The ATPase cycle mechanism of the DEAD-box rRNA helicase, DbpA
Abstract
DEAD-box proteins are ATPase enzymes that destabilize and unwind duplex RNA. Quantitative knowledge of the ATPase cycle parameters is critical for developing models of helicase activity. However, limited information regarding the rate and equilibrium constants defining the ATPase cycle of RNA helicases is available, including the distribution of populated biochemical intermediates, the catalytic step(s) that limits the enzymatic reaction cycle, and how ATP utilization and RNA interactions are linked. We present a quantitative kinetic and equilibrium characterization of the ribosomal RNA (rRNA)-activated ATPase cycle mechanism of DbpA, a DEAD-box rRNA helicase implicated in ribosome biogenesis. rRNA activates the ATPase activity of DbpA by promoting a conformational change after ATP binding that is associated with hydrolysis. Chemical cleavage of bound ATP is reversible and occurs via a gamma-phosphate attack mechanism. ADP-P(i) and RNA binding display strong thermodynamic coupling, which causes DbpA-ADP-P(i) to bind rRNA with >10-fold higher affinity than with bound ATP, ADP or in the absence of nucleotide. The rRNA-activated steady-state ATPase cycle of DbpA is limited both by ATP hydrolysis and by P(i) release, which occur with comparable rates. Consequently, the predominantly populated biochemical states during steady-state cycling are the ATP- and ADP-P(i)-bound intermediates. Thermodynamic linkage analysis of the ATPase cycle transitions favors a model in which rRNA duplex destabilization is linked to strong rRNA and nucleotide binding. The presented analysis of the DbpA ATPase cycle reaction mechanism provides a rigorous kinetic and thermodynamic foundation for developing testable hypotheses regarding the functions and molecular mechanisms of DEAD-box helicases.
Figures


 ) or DbpA·PTC (
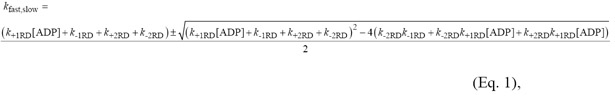
 ). Solid lines are the fits to Eq. 33 of Appendix.. D. [mantATP]-dependence of the slow observed rate constant for binding to DbpA·PTC-RNA (
 ). The solid line represents the best fit to Eq. 34 of Supplementary Material with the apparent Kd constrained to 51 μM as predicted from the ratio of the rate constants determined from data in Panel C. Uncertainty bars represent standard errors in the fits.
 ) and slow phase (
 ). Both solid lines are the fits to Eq. 2. C. The [mantADP]-dependence of the slow observed rate constant of binding mantADP to DbpA-PTC-RNA. Uncertainty bars represent standard errors in the fits. The solid line is the best fit to Eq. 2. D. Time course of mantADP dissociation from DbpA-PTC-RNA after mixing an equilibrated sample of 1 μM DbpA-PTC-RNA and 125 μM mantADP with 2 mM MgADP. The smooth lines are the best fits of the data to double exponentials with a fast observed rate constant of 169.8 (± 4.5) s-1 comprising 82% of the amplitude and a slow observed rate constant of 39.7 (± 2.7) s-1.


References
-
- Cordin O, Banroques J, Tanner NK, Linder P. The DEAD-box protein family of RNA helicases. Gene. 2006;367:17–37. - PubMed
-
- Fairman ME, Maroney PA, Wang W, Bowers HA, Gollnick P, Nilsen TW, Jankowsky E. Protein displacement by DExH/D “RNA helicases” without duplex unwinding. Science. 2004;304:730–4. - PubMed
-
- Linder P, Lasko PF, Ashburner M, Leroy P, Nielsen PJ, Nishi K, Schnier J, Slonimski PP. Birth of the D-E-A-D box. Nature. 1989;337:121–2. - PubMed
Publication types
MeSH terms
Substances
Grants and funding
LinkOut - more resources
Full Text Sources
Molecular Biology Databases
Research Materials
Miscellaneous
