. 2008 Mar 14;377(1):28-46.
doi: 10.1016/j.jmb.2007.12.038. Epub 2008 Jan 30.

Transcriptional activation of the suppressor of cytokine signaling-3 (SOCS-3) gene via STAT3 is increased in F9 REX1 (ZFP-42) knockout teratocarcinoma stem cells relative to wild-type cells

Affiliations

Transcriptional activation of the suppressor of cytokine signaling-3 (SOCS-3) gene via STAT3 is increased in F9 REX1 (ZFP-42) knockout teratocarcinoma stem cells relative to wild-type cells

Juliana Xu et al. J Mol Biol. .

Abstract

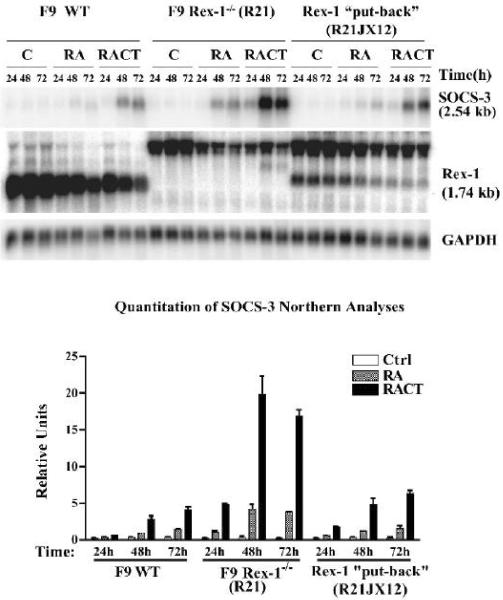
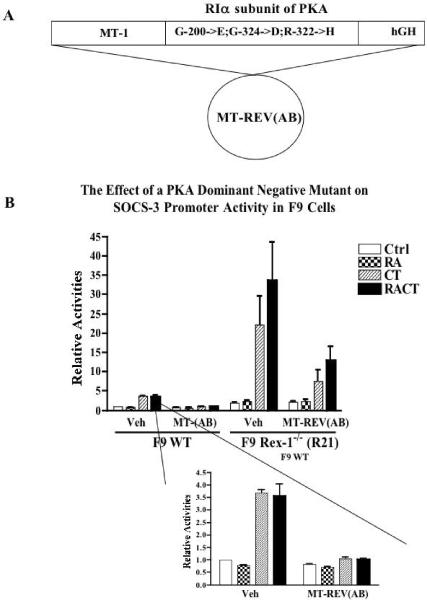
Rex1 (Zfp42), first identified as a gene that is transcriptionally repressed by retinoic acid (RA), encodes a zinc finger transcription factor expressed at high levels in F9 teratocarcinoma stem cells, embryonic stem cells, and other stem cells. Loss of both alleles of Rex1 by homologous recombination alters the RA-induced differentiation of F9 cells, a model of pluripotent embryonic stem cells. We identified Suppressor of Cytokine Signaling-3 (SOCS-3) as a gene that exhibits greatly increased transcriptional activation in RA, cAMP, and theophylline (RACT)-treated F9 Rex1(-/-) cells (approximately 25-fold) as compared to wild-type (WT) cells ( approximately 2.5-fold). By promoter deletion, mutation, and transient transfection analyses, we have shown that this transcriptional increase is mediated by the STAT3 DNA-binding elements located between -99 to -60 in the SOCS-3 promoter. Overexpression of STAT3 dominant-negative mutants greatly diminishes this SOCS-3 transcriptional increase in F9 Rex1(-/-) cells. This increase in SOCS-3 transcription is associated with a four- to fivefold higher level of tyrosine-phosphorylated STAT3 in the RACT-treated F9 Rex1(-/-) cells as compared to WT. Dominant-negative Src tyrosine kinase, Jak2, and protein kinase A partially reduce the transcriptional activation of the SOCS 3 gene in RACT-treated F9 Rex1 null cells. In contrast, parathyroid hormone peptide enhances the effect of RA in F9 Rex1(-/-) cells, but not in F9 WT. Thus, Rex1, which is highly expressed in stem cells, inhibits signaling via the Janus kinase (JAK)/signal transducer and activator of transcription (STAT) pathway, thereby modulating the differentiation of F9 cells.


Figures

Figure 1
Figure 1. The expression of the SOCS-3 gene was induced in response to RA and dibutyryl cAMP in F9 Wt cells and F9 Rex1−/− cells: Northern analysis of SOCS-3
F9 Wt cells and two independent Rex1−/− lines (R21 and R5) were cultured for 24 h, 48 h, or 72 h in the presence of 1 μM RA, 250 μM dibutyryl cAMP, and 250 μM theophylline (RACT). Total RNA was extracted for Northern analysis. The same filter was used for Northern analysis of Rex1. The higher molecular mass Rex1 signals in the two knockout lines occur because these transcripts contain a neomycinR gene which disrupts the Rex1 protein coding sequence. GAPDH was used as a loading control. Below the Northern analyses is the quantitative analysis of the effect of RA, CT, and RACT on SOCS-3 mRNA levels in F9 WT and F9 Rex1−/− cells based on three repeats of the same experiment with different RNA preparations. The data are shown as the mean ± SD.
Figure 2
Figure 2. Stable Transfection of Exogenous Rex1 into the Rex1−/− Cells Partially Restored the Pattern of SOCS-3 Expression
F9 Wt and F9 Rex1−/− (R21), and the Rex1 stable transfectant (R21JX12, which contains the Rex1 cDNA driven by the SV40 promoter stably transfected into the Rex−/− R21 line) cells were cultured for 24 h, 48 h, or 72 h in the presence of 1 μM RA, 250 μM db cAMP, and 250 μM theophylline (RACT). Total RNA was extracted for Northern analysis. The same filter was used for the Northern analysis of Rex1. The Rex1 transcript is 1.74kb. (The larger transcript in the Rex1−/− cell lines contains the neomycin resistance gene in a position which interrupts the Rex1 open reading frame.) GAPDH was used as a loading control. Below the Northern analyses is the quantitative analysis of the effect of RA, CT, and RACT on SOCS-3 mRNA levels in F9 WT, R21, and R21JX12 cells, based on three repeats of the same experiment starting with different RNA preparations. The data are shown as the mean ± SD.
Figure 3
Figure 3. SOCS-3 protein is induced in response to RA and dibutyryl cAMP in F9 Wt cells and F9 Rex1−/− cells (monolayer culture): Western analysis of SOCS-3
F9 Wt cells, two Rex1−/− cell lines (R21, R5), and a Rex1 put-back line (R21JX12) were cultured for 72 hours in the presence of various drugs as indicated. 100 μg of total protein was used for SOCS-3 Western analysis and β-actin was used as a loading control. This experiment was repeated three times with similar results.
Figure 4
Figure 4. Induction of the SOCS-3 promoter/reporter activity in F9 Wt and F9 Rex1−/− cells in response to RA, CT, and RACT
(A) Graphic representation of the ≈3.7 kb genomic 5' flanking region of the murine SOCS-3 promoter. The tandem STAT3 binding sites (in bold) and the start codon ATG are shown on the top. Diagrams of each pGL3 Basic-derived construct linked to the firefly luciferase reporter gene with different forms of the mouse SOCS-3 promoter are presented. The numbers refer to the 5' and 3' terminal nucleotides included in each construct with respect to the transcription start site of the above sequence. (B) F9 WT, Rex1−/− R21, Rex1−/− R5, and R21JX12 cells were transiently transfected with 4 μg of pGL3 Basic, clone 2, clone 6, or clone 6D2C. Each cell line was also co-transfected with 1.5 μg of a Renilla luciferase plasmid as a transfection control. Sixteen hours after the transfection, fresh medium was replaced in the presence of 1 μM RA, 250 μM db cAMP, and 250 μM theophylline (RACT). After 48 h of treatment, cells were harvested for luciferase assay. Firefly luciferase activity was normalized to the corresponding Renilla luciferase activity. Relative luciferase activity was calculated as a ratio over nonstimulated F9 Wt cells transfected with clone 6. Mean values with error bars as indicated are from four independent experiments. (C) F9 WT and Rex−/− cells were co-transfected with 4 μg of construct 6 and 2, 4, 6 μg, or no psg-Rex1. pSG5 “vector” plasmid was used to equalize the total amount of DNA used for transfection. Each cell line was also co-transfected with 1.5 μg Renilla luciferase plasmid as a transfection control. Sixteen hours after transfection, fresh medium was replaced in the presence of 1 μM RA, 250 μM dibutyryl camp and 250 μM theophylline (RACT). After 48 hours, cells were harvested for luciferase assays. This experiment was performed twice; average values are plotted.
Figure 5
Figure 5. Induction of SOCS-3 promoter/reporter activity by RA, CT, and RACT: effect of STAT3 mutants
(A) Schematic representation of various STAT3 constructs. LZ, leucine zipper domain; R, arginine; Y, tyrosine; S, serine; F, phenylalanine; C, cysteine; A, alanine; N, asparagine. These constructs include the WTSTAT3, two DN mutants of STAT3 (Y705F and D715), and the constitutively active mutant of STAT3 (STAT3C). For Y715, the tyrosine residue in the C-terminus is mutated to phenylalanine. D715 lacks the C-terminal transcriptional activation domain. For STAT3C, an alanine residue and an asparagine residue within the C-loop of the SH2 domain are both mutated to cysteine residues. (B) F9 Wt and R21 Rex1−/− cells were co-transfected with 4 μg of construct 6 and 4 μg of each of the STAT3 constructs in A (or 4 μg of pUC19 V=vehicle). As a negative control, F9 WT and R21 cells were co-transfected with 4 μg of construct 6 and 4 μg of pSG5. Each cell line was also cotransfected with 1.5 μg of the Renilla luciferase plasmid as a transfection control. Sixteen hours after the transfection, fresh medium was replaced in the presence 1 μM RA, 250 μM dibutyryl cAMP, and 250 μM theophylline (RACT). After 48 h of treatment, cells were harvested for luciferase assays. Firefly luciferase activity was normalized to the corresponding Renilla luciferase activity. Relative luciferase activity was calculated as a ratio over unstimulated F9 Wt cells transfected with construct 6 and pSG5. Mean values with error bars (±SD) as indicated are from four independent experiments. SD = standard deviation.
Figure 6
Figure 6. The expression of STAT3 mRNA and STAT3 protein in F9 Wt versus F9 Rex1−/−cells
(A) Northern analysis of STAT3. F9 Wt cells and two independent F9 Rex1−/− lines (R21 and R31) were cultured for 24 h, 48 h, or 72 h in the presence of 1 μM RA, 250 μM db cAMP, and 250 μM theophylline (RACT). Total RNA was extracted for Northern analysis. GAPDH was used as a loading control. Below the Northern analyses is the quantitative analysis of the effects of RA, CT, and RACT on STAT3 mRNA levels in F9 Wt and F9 Rex1−/− cells, based on three repeats of the same experiment. (B) Western analyses of total STAT3 protein and tyrosine phosphorylated STAT3. F9 Wt cells, two independent Rex1−/− lines (R21 and R31), and the Rex1 “put-back” line (R21JX12) were cultured for 48 h, in the presence of 1 μM RA, 250 μM dibutyryl cAMP, and 250 μM theophylline (RACT). Total protein was harvested, and 45 μg protein was used for Western analyses. Western analyses of total STAT3 and p-STAT3 were repeated numerous times with different time points, and very similar results were obtained. Below the Western analyses is the quantitative analysis of the effects of RA, CT, and RACT on p-STAT3 protein level over total STAT3 protein level for the Western analyses shown above. SOCS-3 protein levels are also shown for comparison.
Figure 7
Figure 7. Induction of the SOCS-3 promoter/reporter activity by RA, CT, and RACT: The effect of a PKA Dominant Negative mutant
(A) The schematic representation of the PKA DN mutant in MT-REV(AB) expression vector. This construct contains the cDNA for the RIα of PKA. Point mutations in both cAMP-binding domain sites are present (Gly-200 -> Glu; Gly-324 ->Asp; Arg-322 -> His) which prevent cAMP binding and activation of the kinase. Transcription of the construct is directed by the metallothionein-1 (MT-1) promoter, and a polyadenylylation signal is provided by the 3' human growth hormone (hGH) sequence. (B) F9 WT and R21 Rex1−/− cells were co-transfected with 4 μg of construct 6 (see Fig. 4) and 3 μg of the DN PKA mutant construct MT-REV(AB). As a negative control, F9 Wt and R21 cells were co-transfected with 4 μg of construct 6 and 3 μg of the “empty vector” MT64AA (Veh). Each cell line was also co-transfected with 1.5 μg of the Renilla luciferase plasmid as a transfection control. Sixteen hours after the transfection, fresh medium was replaced in the presence 1 μM RA, 250 μM dibutyryl cAMP, and 250 μM theophylline (RACT). After 48 h of treatment, cells were harvested for luciferase assays. Firefly luciferase activity was normalized to the corresponding Renilla luciferase activity. Relative luciferase activity was calculated as a ratio over unstimulated F9 Wt cells transfected with construct 6 and MT64AA. Mean values with error bars as indicated are from three independent experiments.
Figure 8
Figure 8. Induction of the SOCS-3 promoter/reporter activity by RA, CT, and RACT: The effects of the Src DN, Jak1 DN, and Jak2 DN expression vectors
(A) The schematic representation of the DN mutants of Jak1, Jak2, and Src. The DN mutant of Jak1 contains a 3-amino acid change in the conserved region VIII of the kinase domain (FWYAPE -> LTYAPV) that impairs its catalytic function. The DN mutant of Jak2 contains a single amino acid change (Lys -> Ala) at the ATP-binding site, resulting in impaired binding of ATP and catalytic activity. The DN mutant of Src (Upstate Biotechnology, Cat# 21–154) contains two point mutations (Arg-296 -> Lys; Tyr-528 -> Phe) in the kinase domain that inactivate its catalytic activity. (B) F9 Wt and R21 cells were co-transfected with 4 μg of construct 6 and 4 μg of each of these DN mutant constructs. As a negative control, F9 Wt and R21 cells were co-transfected with 4 μg of construct 6 and 4 μg of pUC9. Each cell line was also co-transfected with 1.5 μg of the Renilla luciferase plasmid as a transfection control. Sixteen hours after the transfection, fresh medium was replaced in the presence 1 μM RA, 250 μM dibutyryl cAMP, and 250 μM theophylline (RACT). After 48 h of treatment, cells were harvested for luciferase assays. Firefly luciferase activity was normalized to the corresponding Renilla luciferase activity. Relative luciferase activity was calculated as a ratio over unstimulated F9 WT cells transfected with construct 6 and pUC9. Mean values with error bars as indicated are from three independent experiments.
Figure 9
Figure 9. RARα stimulates SOCS3 promoter activity through the STAT3 binding sites
F9 WT and Rex−/− (R21) cells were transiently transfected with 4 μg of construct 6 or construct 6D2C (see Fig. 4A). Each cell line was also co-transfected with 4 μg pSG-RARα or Psg5 “empty” vector as a negative control. 1.5 μg Renilla luciferase plasmid was co-transfected as a transfection control for each cell line. Sixteen hours after transfection, fresh medium was replaced in the presence 1 μM RA, 250 μM dibutyryl AMP, and 250 μM theophylline (RACT). After 48 hours, cells were harvested for luciferase assays. Relative luciferase activity was calculated. Mean values with error bars are shown.
Figure 10
Figure 10. A. The effect of parathyroid hormone (PTH) and β-mercaptoethanol on RA- and RACT-induced SOCS-3 expression: Northern analysis of SOCS-3
F9 WT cells and R21 cells were cultured for 40 h and 72 h in the presence of 1 μM RA, 250 μM db cAMP, and 250 μM theophylline (RACT). To examine the effects of PTH and BME on SOCS-3 mRNA levels, 5 nM or 50 nM of bPTH, and 0.5 mM BME were added to the cells, together with RA and RACT. Total RNA was extracted for Northern analysis. 28S rRNA was used as a loading control. The lanes represent: 1) control, 2) RA, 3) CT, 4) RACT, 5) 50 nM bPTH, 6) RA + 5 nM bPTH, 7) RA + 50 nM bPTH, 8) RACT + 10 μM BME. This experiment was repeated twice with similar results; one experiment is shown. B. Model for SOCS3 transcriptional activation in F9 cells In F9 Wt, cyclic AMP acts via pKA, c-Src, and Jak2 to phosphorylate and thereby activate Stat3 protein. RA acts to increase the total amount of Stat3 protein by increasing the transcription of the Stat3 gene. In F9 Rex1 null cells, lower levels of STAT3 inhibitory proteins could result in increased STAT3 activity.

Similar articles

Cited by

References

    1. Gudas LJ. Molecular mechanisms of retinoid action. Am J Respir Cell Mol Biol. 1990;2:319–20. - PubMed
    1. Gudas LJ. Retinoids and vertebrate development. J Biol Chem. 1994;269:15399–402. - PubMed
    1. Means AL, Gudas LJ. The roles of retinoids in vertebrate development. Ann. Rev. Biochem. 1995;64:210–233. - PubMed
    1. Mongan NP, Gudas LJ. Diverse actions of retinoid receptors in cancer prevention and treatment. Differentiation. 2007 In press. - PubMed
    1. Mark M, Ghyselinck NB, Chambon P. Function of retinoid nuclear receptors: lessons from genetic and pharmacological dissections of the retinoic acid signaling pathway during mouse embryogenesis. Annu Rev Pharmacol Toxicol. 2006;46:451–80. - PubMed

Publication types

MeSH terms