

Fungi have three tetraspanin families with distinct functions
- PMID: 18241352
- PMCID: PMC2278132
- DOI: 10.1186/1471-2164-9-63
Fungi have three tetraspanin families with distinct functions
Abstract
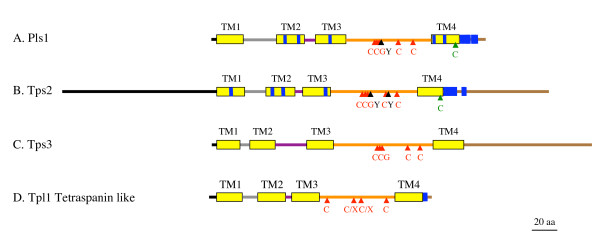
Background: Tetraspanins are small membrane proteins that belong to a superfamily encompassing 33 members in human and mouse. These proteins act as organizers of membrane-signalling complexes. So far only two tetraspanin families have been identified in fungi. These are Pls1, which is required for pathogenicity of the plant pathogenic ascomycetes, Magnaporthe grisea, Botrytis cinerea and Colletotrichum lindemuthianum, and Tsp2, whose function is unknown. In this report, we describe a third family of tetraspanins (Tsp3) and a new family of tetraspanin-like proteins (Tpl1) in fungi. We also describe expression of some of these genes in M. grisea and a basidiomycete, Laccaria bicolor, and also their functional analysis in M. grisea.
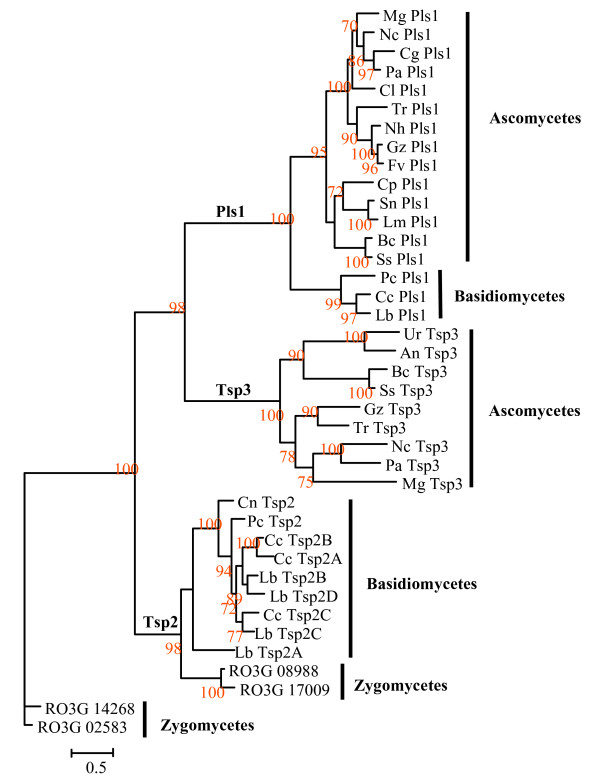
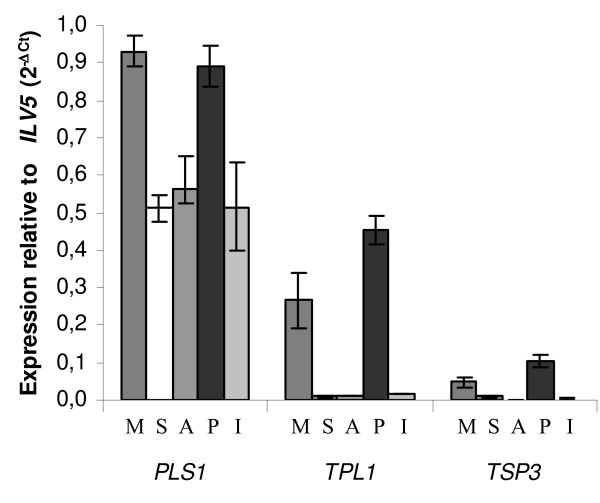
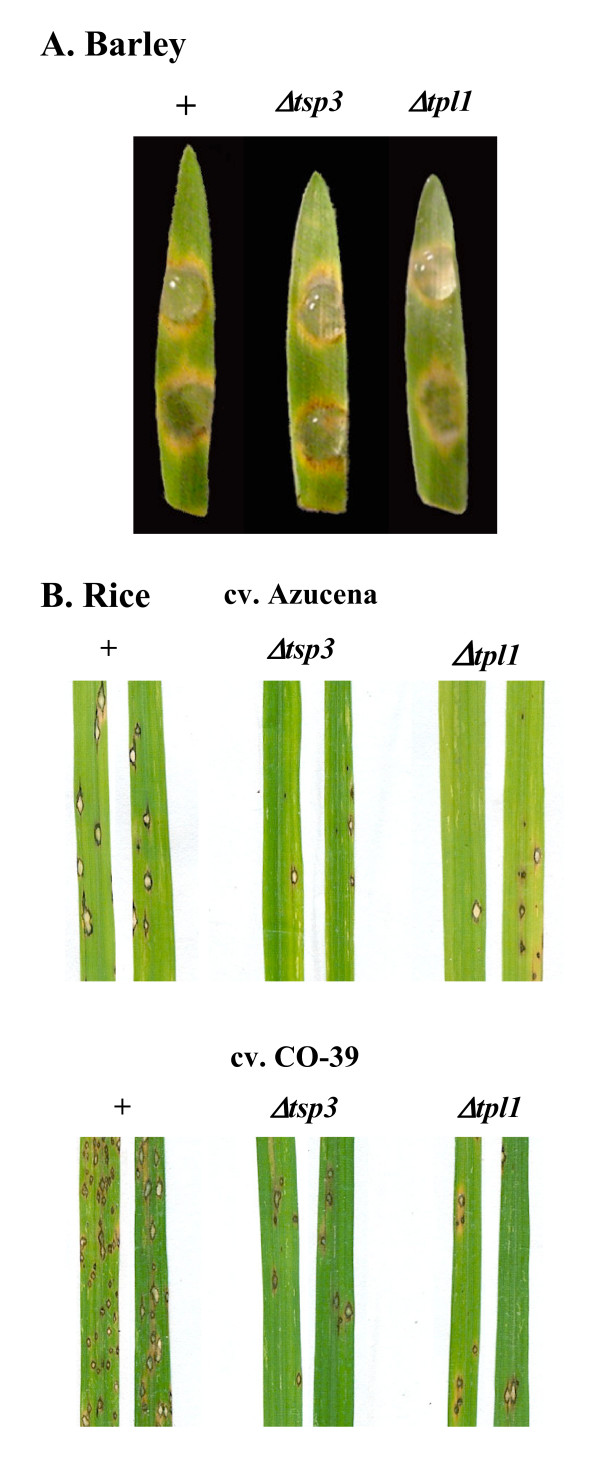
Results: The exhaustive search for tetraspanins in fungal genomes reveals that higher fungi (basidiomycetes and ascomycetes) contain three families of tetraspanins (Pls1, Tsp2 and Tsp3) with different distribution amongst phyla. Pls1 is found in ascomycetes and basidiomycetes, whereas Tsp2 is restricted to basidiomycetes and Tsp3 to ascomycetes. A unique copy of each of PLS1 and TSP3 was found in ascomycetes in contrast to TSP2, which has several paralogs in the basidiomycetes, Coprinus cinereus and Laccaria bicolor. A tetraspanin-like family (Tpl1) was also identified in ascomycetes. Transcriptional analyses in various tissues of L. bicolor and M. grisea showed that PLS1 and TSP2 are expressed in all tissues in L. bicolor and that TSP3 and TPL1 are overexpressed in the sexual fruiting bodies (perithecia) and mycelia of M. grisea, suggesting that these genes are not pseudogenes. Phenotypic analysis of gene replacementmutants Deltatsp3 and Deltatpl1 of M. grisea revealed a reduction of the pathogenicity only on rice, in contrast to Deltapls1 mutants, which are completely non-pathogenic on barley and rice.
Conclusion: A new tetraspanin family (Tsp3) and a tetraspanin-like protein family (Tpl1) have been identified in fungi. Functional analysis by gene replacement showed that these proteins, as well as Pls1, are involved in the infection process of the plant pathogenic fungus M. grisea. The next challenge will be to decipher the role(s) of tetraspanins in a range of symbiotic, saprophytic and human pathogenic fungi.
Figures


Similar articles
-
A new class of tetraspanins in fungi.Biochem Biophys Res Commun. 2002 Oct 11;297(5):1197-204. doi: 10.1016/s0006-291x(02)02355-0. Biochem Biophys Res Commun. 2002. PMID: 12372414
-
Fungal Pls1 tetraspanins as key factors of penetration into host plants: a role in re-establishing polarized growth in the appressorium?FEMS Microbiol Lett. 2006 Mar;256(2):179-84. doi: 10.1111/j.1574-6968.2006.00128.x. FEMS Microbiol Lett. 2006. PMID: 16499604 Review.
-
The crucial role of the Pls1 tetraspanin during ascospore germination in Podospora anserina provides an example of the convergent evolution of morphogenetic processes in fungal plant pathogens and saprobes.Eukaryot Cell. 2008 Oct;7(10):1809-18. doi: 10.1128/EC.00149-08. Epub 2008 Aug 29. Eukaryot Cell. 2008. PMID: 18757568 Free PMC article.
-
Novel G-protein-coupled receptor-like proteins in the plant pathogenic fungus Magnaporthe grisea.Genome Biol. 2005;6(3):R24. doi: 10.1186/gb-2005-6-3-r24. Epub 2005 Mar 2. Genome Biol. 2005. PMID: 15774025 Free PMC article.
-
Moving toward a systems biology approach to the study of fungal pathogenesis in the rice blast fungus Magnaporthe grisea.Adv Appl Microbiol. 2005;57:177-215. doi: 10.1016/S0065-2164(05)57006-0. Adv Appl Microbiol. 2005. PMID: 16002013 Review. No abstract available.
Cited by
-
Arabidopsis Tetraspanins Facilitate Virus Infection via Membrane-Recognition GCCK/RP Motif and Cysteine Residues.Front Plant Sci. 2022 Mar 3;13:805633. doi: 10.3389/fpls.2022.805633. eCollection 2022. Front Plant Sci. 2022. PMID: 35310653 Free PMC article.
-
Molecular cloning, sequence characterization and expression analysis of a CD63 homologue from the coleopteran beetle, Tenebrio molitor.Int J Mol Sci. 2013 Oct 15;14(10):20744-67. doi: 10.3390/ijms141020744. Int J Mol Sci. 2013. PMID: 24132157 Free PMC article.
-
The development of extracellular vesicle markers for the fungal phytopathogen Colletotrichum higginsianum.J Extracell Vesicles. 2022 May;11(5):e12216. doi: 10.1002/jev2.12216. J Extracell Vesicles. 2022. PMID: 35524440 Free PMC article.
-
Knockdown of Bmp1 and Pls1 Virulence Genes by Exogenous Application of RNAi-Inducing dsRNA in Botrytis cinerea.Int J Mol Sci. 2023 Mar 2;24(5):4869. doi: 10.3390/ijms24054869. Int J Mol Sci. 2023. PMID: 36902297 Free PMC article.
-
Critical role of exosomes in sperm-egg fusion and virus-induced cell-cell fusion.Reprod Med Biol. 2013 May 24;12(4):117-126. doi: 10.1007/s12522-013-0152-2. eCollection 2013 Oct. Reprod Med Biol. 2013. PMID: 29699139 Free PMC article. Review.
References
-
- Clergeot PH, Gourgues M, Cots J, Laurans F, Latorse MP, Pepin R, Tharreau D, Notteghem JL, Lebrun MH. PLS1, a gene encoding a tetraspanin-like protein, is required for penetration of rice leaf by the fungal pathogen Magnaporthe grisea. Proc Natl Acad Sci USA. 2001;98:6963–6968. doi: 10.1073/pnas.111132998. - DOI - PMC - PubMed
-
- Cnops G, Neyt P, Raes J, Petrarulo M, Nelissen H, Malenica N, Luschnig C, Tietz O, Ditengou F, Palme K, et al. The TORNADO1 and TORNADO2 genes function in several patterning processes during early leaf development in Arabidopsis thaliana. Plant Cell. 2006;18:852–866. doi: 10.1105/tpc.105.040568. - DOI - PMC - PubMed
Publication types
MeSH terms
Substances
LinkOut - more resources
Full Text Sources
Medical
Molecular Biology Databases
Miscellaneous
