

doi: 10.1016/j.febslet.2008.01.019.
Epub 2008 Jan 31.
Regulation of SIRT6 protein levels by nutrient availability
Affiliations
- PMID: 18242175
- PMCID: PMC3263697
- DOI: 10.1016/j.febslet.2008.01.019
Item in Clipboard
Regulation of SIRT6 protein levels by nutrient availability
FEBS Lett.
.
Abstract
Sirtuins have been shown to regulate life-span in response to nutritional availability. We show here that levels of the mammalian sirtuin, SIRT6, increased upon nutrient deprivation in cultured cells, in mice after fasting, and in rats fed a calorie-restricted diet. The increase in SIRT6 levels is due to stabilization of SIRT6 protein, and not via an increase in SIRT6 transcription. In addition, p53 positively regulates SIRT6 protein levels under standard growth conditions but has no role in the nutrient-dependent regulation of SIRT6. These observations imply that at least two sirtuins are involved in regulation of life-span by nutrient availability.
Figures
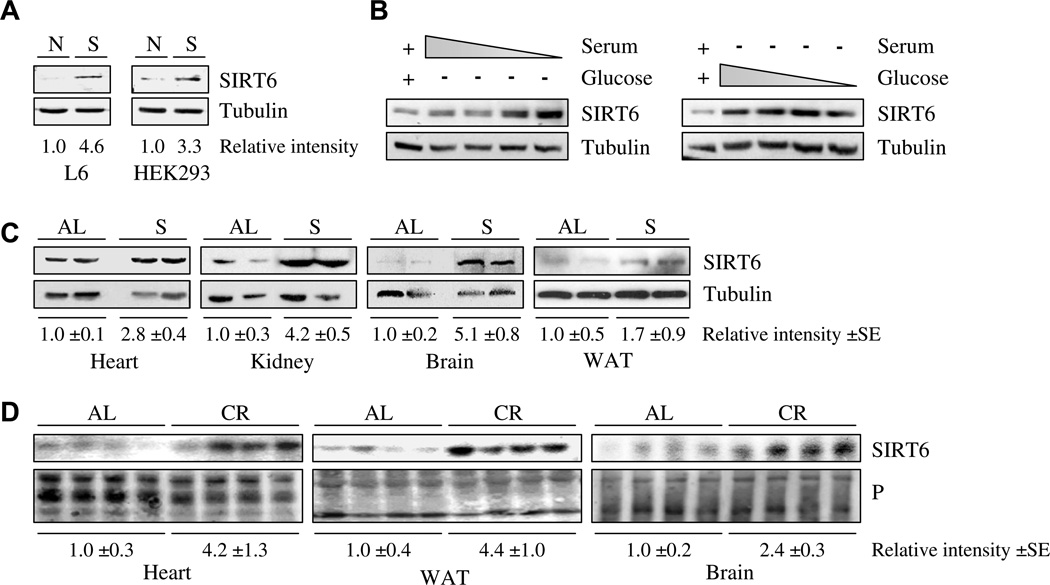
SIRT6 is induced by nutrient deprivation: (A) SIRT6 protein levels in rat myoblast L6 or human embryonic kidney HEK293 cells grown in full medium [N], or starved [S]. (B) HEK293 cells were grown in serum free growth medium and decreased tenfold dilutions of glucose (right panel), or in glucose free growth medium and decreased tenfold dilutions of serum (left panel). Complete standard growth medium served as a control in each experiment (left lane). (C) Extracts of kidney, brain or WAT tissues from mice fed an ad libitum diet [AL] or mice fed for 24 h a water-only diet [S], were separated by SDS–polyacrylamide gel electrophoresis (SDS–PAGE) and probed with specific rabbit polyclonal antibodies against SIRT6. The data generated from two (out of five) representative mice from each treatment are shown; each lane represents an individual mouse. Tubulin levels served as a loading control. (D) Male Fisher 344 rats were fed either NIH-31 standard feed AL or CR diet until sacrifice at 12 or 24 months of age. Extracts of heart, WAT or brain tissues from AL and CR animals were separated by SDS–PAGE and probed with a specific rabbit polyclonal antibody against SIRT6. Equal amounts of protein extract were loaded onto each lane as measured by Bradford assay and by subsequent Ponceau protein staining of the membrane (P). Band intensity measurements were done using ImageJ analysis. Each lane represents a different rat.
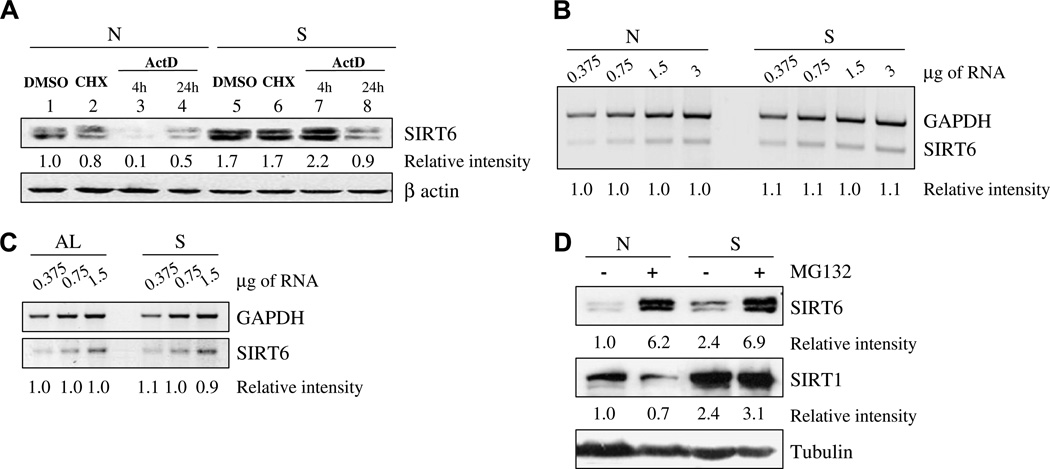
The increase in SIRT6 upon nutrient deprivation is due to an increase in its protein stability: (A) SDS–PAGE analysis of SIRT6 in HEK293 cells supplemented with normal levels of nutrients [N], or starved [S], in the presence or absence of the following agents: The translation inhibitor cyclohexamide (CHX) for 4 h; RNA transcription inhibitor actinomycin D (ActD) for 4 or 24 h; or dimethyl sulfoxide (DMSO), which served as a solvent control. (B) Semi-quantitative RT-PCR analysis of SIRT6 gene transcription of HEK293 cells under normal [N] or starvation [S] conditions. (C) Semi-quantitative RT-PCR analysis of SIRT6 gene transcription of kidney tissues from mice fed an ad libitum diet [AL], or mice fed for 24 h a water-only diet [S]. (D) SDS–PAGE analysis of SIRT1 and SIRT6 in HEK293 cells supplemented with normal levels of nutrients [N] or starved [S], in the presence or absence of a proteasomal degradation inhibitor, MG132. In each panel, the intensity of a given band relative to the relevant loading control (beta-actin or tubulin for proteins and GAPDH for RNA) is indicated below each lane. Band intensity measurements were done using ImageJ analysis. For RT-PCR, the RNA templates were serially diluted (the amount of RNA is indicated above the panel).
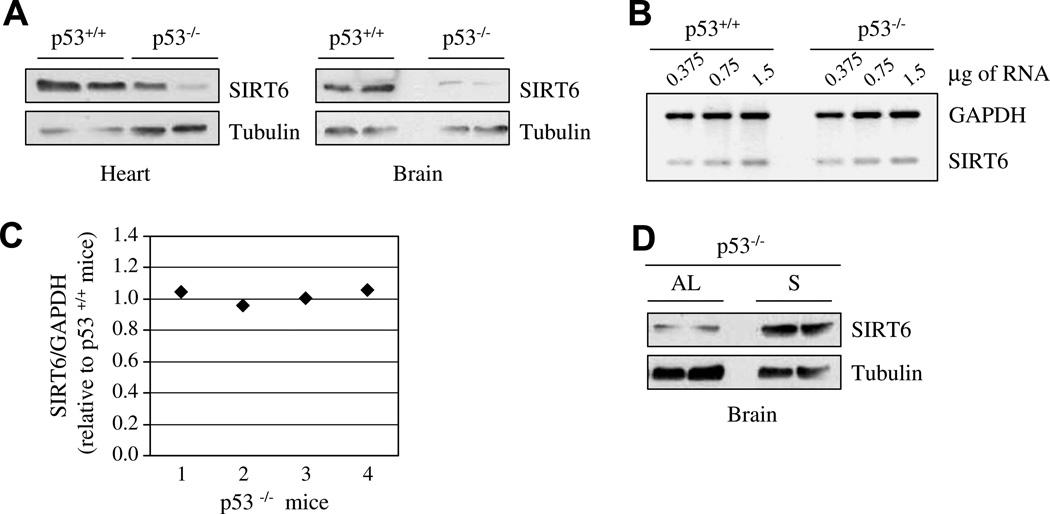
p53 regulates SIRT6 levels: (A) Protein extracts of brain or heart tissues from wild type or p53−/− mice maintained on a normal diet were separated by SDS–PAGE. SIRT6 protein levels were measured with specific rabbit polyclonal antibody against SIRT6. (B) Representative semi-quantitative RT-PCR of SIRT6 RNA levels in the brain of wild type or p53−/− mice fed with AL diet. (C) The ratio between SIRT6 mRNA and GAPDH mRNA in each p53−/− mice versus wild type mice, as measured by densitometric analysis, was plotted and shown in a graph. Band intensity measurements were done using ImageJ analysis. (D) SIRT6 protein levels in the brain were also measured in p53−/− mice fed normally [AL], or with water only for 24 h [S].
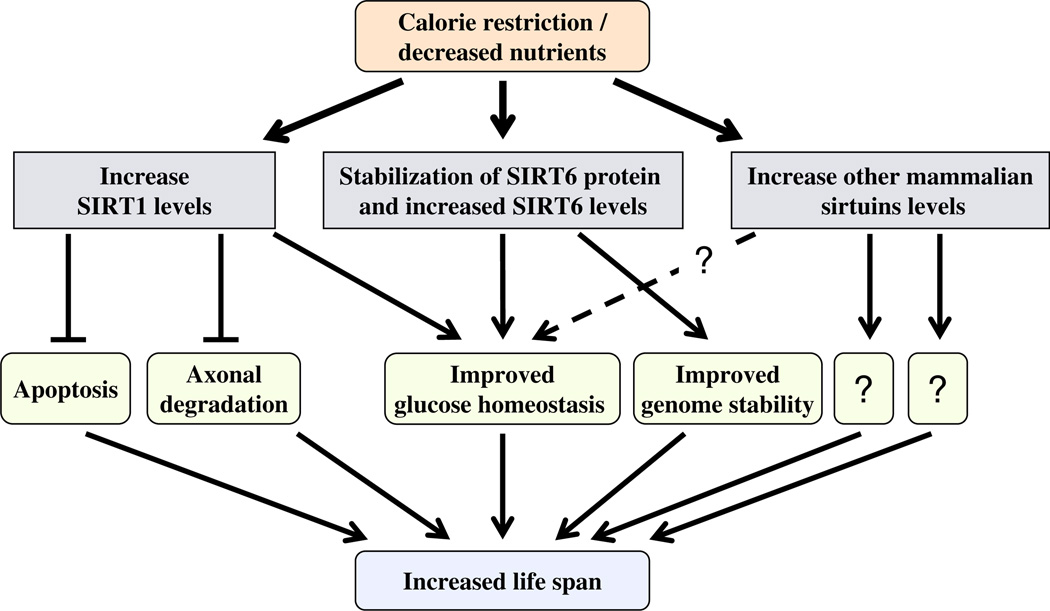
Combinatorial regulation of sirtuin levels under decreased nutrient growth conditions. In response to CR or nutrient deprivation, the level of various sirtuins (SIRT1, SIRT6 and possibly others) increased in different tissues. As a result, sirtuin-dependent pathways are affected and the combinatorial outcome is expressed as the beneficial effect of CR on age-related pathologies.
References
-
- Blander G, Guarente L. The Sir2 family of protein deacetylases. Annu. Rev. Biochem. 2004;73:417–435. - PubMed
-
- Liszt G, Ford E, Kurtev M, Guarente L. Mouse Sir2 homolog SIRT6 is a nuclear ADP-ribosyltransferase. J. Biol. Chem. 2005;280:21313–21320. - PubMed
-
- Howitz KT, Bitterman KJ, Cohen HY, Lamming DW, Lavu S, Wood JG, Zipkin RE, Chung P, Kisielewski A, Zhang LL, Scherer B, Sinclair DA. Small molecule activators of sirtuins extend Saccharomyces cerevisiae lifespan. Nature. 2003;425:191–196. - PubMed
-
- Tissenbaum HA, Guarente L. Increased dosage of a sir-2 gene extends lifespan in Caenorhabditis elegans. Nature. 2001;410:227–230. - PubMed
Publication types
MeSH terms
Substances
Grants and funding
LinkOut - more resources
Full Text Sources
Other Literature Sources
Molecular Biology Databases
Research Materials
Miscellaneous
