. 2008 Feb;13(2):129-40.
doi: 10.1016/j.ccr.2008.01.003.

The loss of Nf1 transiently promotes self-renewal but not tumorigenesis by neural crest stem cells

Affiliations

The loss of Nf1 transiently promotes self-renewal but not tumorigenesis by neural crest stem cells

Nancy M Joseph et al. Cancer Cell. 2008 Feb.

Abstract

Neurofibromatosis is caused by the loss of neurofibromin (Nf1), leading to peripheral nervous system (PNS) tumors, including neurofibromas and malignant peripheral nerve sheath tumors (MPNSTs). A long-standing question has been whether these tumors arise from neural crest stem cells (NCSCs) or differentiated glia. Germline or conditional Nf1 deficiency caused a transient increase in NCSC frequency and self-renewal in most regions of the fetal PNS. However, Nf1-deficient NCSCs did not persist postnatally in regions of the PNS that developed tumors and could not form tumors upon transplantation into adult nerves. Adult P0a-Cre+Nf1(fl/-) mice developed neurofibromas, and Nf1(+/-)Ink4a/Arf(-/-) and Nf1/p53(+/-) mice developed MPNSTs, but NCSCs did not persist postnatally in affected locations in these mice. Tumors appeared to arise from differentiated glia, not NCSCs.


Figures
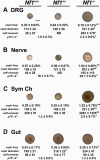
Figure 1
Figure 1. Nf1 negatively regulates the frequency, proliferation, and self-renewal of NCSCs in most regions of the fetal PNS
DRG (A), sciatic nerve (B), sympathetic chain (C), and gut (D) were dissected from E13 Nf1+/+, Nf1+/−, and Nf1−/− mouse embryos. Dissociated cells were plated into non-adherent cultures at low density (1000 to 2500 cells/35mm well for most tissues; 5000 for DRG). Neurospheres were cultured non-adherently for 10 days, followed by 4 days in adherent cultures before being stained for neurons, glia, and myofibroblasts. Typical neurospheres are shown along with the percentage of freshly dissociated cells that formed neurospheres that underwent multilineage differentiation (nsph freq), the diameter of these neurospheres, and the number of multipotent secondary neurospheres generated per primary neurosphere upon subcloning (self-renewal) (*, p<0.05 versus wild-type; #, p<0.05 versus heterozygous). The scale bar (100 μm) in panel A applies to all panels. The frequency of p75+α4+ cells among freshly dissociated cells was significantly increased in DRG (A), sciatic nerve (B), and sympathetic chain (C), but not gut (D). Culture data represent 8 to 12 experiments and flow-cytometry data represent 4 to 7 experiments per tissue. All statistics are mean±SD.
Figure 2
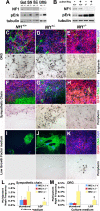
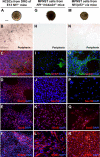
Figure 2. Nf1-deficient NCSCs exhibit increased Ras signaling, increased gliogenesis, and increased survival in low growth factor cultures
. A) Cell lysates from Nf1+/+ and Nf1−/− neurospheres were analyzed for NF1 and phosphorylated Erk 42/44 (pErk) protein levels. B) When Nf1+/+ and Nf1−/− NCSC cultures from sympathetic chain were pulsed with Nrg-1, pErk levels increased in both Nf1+/+ and Nf1−/− cells, but were highest in Nf1−/− cells. NCSCs cultured from E13 Nf1+/+, Nf1+/−, and Nf1−/− DRGs (C-E) and sympathetic chain (F-H) underwent multilineage differentiation, forming peripherin+ neurons, GFAP+ glia, and SMA+ myofibroblasts. More gliogenesis (red) was observed from Nf1−/− NCSCs from DRG (E) and sympathetic chain (H). Nf1+/+ and Nf1+/− cells from sympathetic chain (I-J, L) and DRG (M) failed to form multilineage colonies in low growth factor cultures (LGF), while Nf1−/− cells continued to do so (K; SMA+ myofibroblasts were present in this colony outside of the field of view) (L,M; *, p<0.05 versus control cultures). Brightfield (peripherin) and fluorescence (GFAP, SMA) images always represent the same field of view within a single colony. The scale bar (100 μm) in panel C applies to all panels. Data represent 3−5 independent experiments and error bars represent SD.
Figure 3
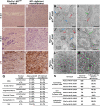
Figure 3. Adult P0aCre+Nf1fl/− mice developed plexiform neurofibromas but NCSCs appeared to differentiate normally and did not persist postnatally
P0aCre+ Nf1-deficient mice developed plexiform neurofibromas in adult peripheral nerves (B) and DRGs (D), marked by increased cellularity and disorganization relative to control nerves (A) and DRGs (C). Neurofibromas also exhibited increased p75 (F) staining relative to control nerves (E). Multipotent neurospheres arose from control and P0aCre+ Nf1-deficient gut, but not from other regions of the adult PNS (G). Neural crest progenitors in developing nerves were fate-mapped by staining sciatic nerves from postnatal day 20 P0aCre+Nf1fl/+R26R (H,I), P0aCre+Nf1fl/−R26R (J,K), and P0aCreNf1fl/−R26R (L,M) pups with bluo-gal (Joseph et al., 2004). We detected no defects in nerve development in Nf1-mutant mice. A similar percentage of endoneurial fibroblasts (green arrows) as well as myelinating (red arrows) and non-myelinating (blue arrows) Schwann cells were bluo-gal+ in P0aCre+Nf1fl/−R26R nerves as compared to littermate controls (N). No bluo-gal staining was observed in P0aCreNf1fl/−R26R negative control nerves (L,M). The scale bar (100 μm) in panel A applies to panels A-F. Scale bars in panels H-M equal 2.5 μm. (n=3−6 mice/genotype for A-G and 2 mice/genotype for H-N). All statistics are mean±SD.
Figure 4
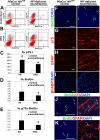
Figure 4. Proliferating cells within plexiform neurofibromas were p75+ and expressed markers of non-myelinating Schwann cells
Sciatic nerves (A, C-E, F-K) and DRGs (B-E) were dissected from adult P0aCre+ Nf1-deficient mice with plexiform neurofibromas and littermate controls. Mice were administered BrdU for 4 days prior to being sacrificed. By flow-cytometry, neurofibromas contained significantly higher frequencies of p75+ cells (A-C), BrdU+ cells (A,B,D), and p75+BrdU+ cells (A,B,E). The vast majority of dividing cells within neurofibromas were p75+ (upper right quadrant of plots in A and B). Immunofluorescence in sections confirmed the increased frequency of BrdU+ cells (F; arrows), p75+ cells (G), and GFAP+ cells (H) in neurofibromas (right column) as compared to control nerves (left column). Normal nerves and neurofibromas lacked BFABP staining (I). Most BrdU+ cells co-stained with p75 (J), and many co-stained with GFAP (K), markers of non-myelinating Schwann cells. In panels J and K double positive cells are indicated with arrows, while possible double positive cells are indicated with asterisks, and cells that are only BrdU positive are indicated with arrowheads. Scale bars in F-K equal 50 μm. Error bars represent SD.
Figure 5
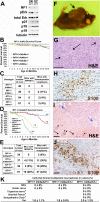
Figure 5. Ink4a/Arf deficiency, but not Ink4a deficiency, collaborates with Nf1 mutations to generate MPNSTs without the postnatal persistence of NCSCs
A) Nf1+/+ and Nf1−/− neural crest cells cultured from sciatic nerve (SN) and sympathetic chain (SC) were analyzed by Western blot. B) Ink4a deficiency did not significantly affect the survival of Nf1+/− mice. C) We detected no MPNSTs among Nf1+/−Ink4a−/− mice or littermate controls. D) The lifespan of Nf1+/− mice was significantly (p<0.05) decreased by Ink4a/Arf deficiency as compared to littermate controls (* versus Nf1+/+Ink4aArf+/−; # versus Nf1+/−Ink4aArf+/−; δ versus Nf1+/+Ink4aArf−/−). Each line in panels B and D represents a cohort of 34−61 mice per genotype (see numbers in panels C and E). Nf1+/−Ink4a/Arf−/− mice developed MPNSTs (panels E-J) as early as P30 but more commonly after 4−6 months of age. Tumors were typically large (F, arrow). Paraffin sections exhibited classic features of MPNSTs including fascicular patterns of tightly packed spindle cells (G, arrows) with hyperchromatic nuclei and frequent mitoses (G). These tumors contained S100+ cells (H), a marker used in the diagnosis of MPNSTs. Some tumors were found embedded in the dermis (I, J) surrounding fat cells (I, blue arrows), sebaceous glands (I, arrows) and hair follicles (I, arrowheads). Dermal tumors stained more intensely for S100 (J) than MPNSTs outside of the dermis (H). Scale bars in G-J equal 100 μm. K) Multipotent neurospheres consistently arose from Nf1+/−Ink4a/Arf−/− and control guts, but not from other regions of the adult PNS (* these tissues were analyzed relative to age-matched wild-type controls). Statistics represent mean±SD for 3 to 6 independent experiments.
Figure 6
Figure 6. Self-renewing spheres grew from Nf1+/−Ink4a/Arf−/− and Nf1/p53+/− MPNSTs but did not form colonies that resembled NCSCs colonies
Some MPNST cells from Nf1+/−Ink4aArf−/− mice and Nf1/p53+/− mice formed self-renewing spheres in culture. While all NCSCs generated peripherin+ neurons (B), GFAP+ glia (C) and SMA+ myofibroblasts (C; arrow), MPNST colonies from Nf1+/−Ink4aArf−/− and Nf1/p53+/− mice failed to generate peripherin+ neurons (H, N) or GFAP+ glia (I, O). In contrast to Nf1−/− NCSC colonies (D), MPNST colonies exhibited little or no Sox10 staining (J,P). MPNST colonies typically contained cells with a glial morphology (data not shown) as well as SMA+ myofibroblasts (I, O). Like Nf1−/− NCSC colonies (E,F), most cells within MPNST colonies were SoxE+ (K,Q) and S100β+ (L,R). These represent typical colonies from 6 independent Nf1−/−Ink4a/Arf−/− MPNSTs and 4 independent Nf1/p53+/− MPNSTs. The scale bar (100 μm) in panel A applies to panels A, G, M while the scale bar (100 μm) in panel B applies to all other panels.
Figure 7
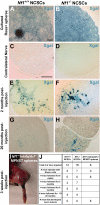
Figure 7. Nf1-deficient NCSCs are not tumorigenic in vivo
We transplanted 50,000 MPNST cells or 50,000 to 100,000 Nf1+/+ or Nf1−/− NCSCs into the nerves of adult Nf1+/− mice. NCSCs were grown as spheres from various regions of the E13 PNS of Nf1+/+ and Nf1−/− mice that had been bred to Rosa mice in some experiments to allow the tracking of cells with Xgal staining (A,B). NCSC spheres were replated to adherent cultures, dissociated to single cell suspensions, and injected into the sciatic nerves of adult Nf1+/− mice. Contralateral nerves never showed Xgal+ cells (C,D) but nerves injected with Rosa+ cells consistently showed engraftment (E-H). MPNST spheres from Nf1+/−Ink4aArf−/− mice were also dissociated and injected into the sciatic nerves of adult Nf1+/− mice (I). Tumors were never observed in mice injected with Nf1+/+ or Nf1−/− neural crest cells, even after 20 months follow-up (E-J). MPNST cells gave rise to large tumors (I) in all recipients within 2 to 6 weeks after injection (J). The scale bar (100 μm) in panel A applies to A-B and the scale bar (100 μm) in panel C applies to C-H.

Similar articles

Cited by

References

    1. Agesen TH, Florenes VA, Molenaar WM, Lind GE, Berner JM, Plaat BE, Komdeur R, Myklebost O, van den Berg E, Lothe RA. Expression patterns of cell cycle components in sporadic and neurofibromatosis type 1-related malignant peripheral nerve sheath tumors. J Neuropathol Exp Neurol. 2005;64:74–81. - PubMed
    1. Bixby S, Kruger GM, Mosher JT, Joseph NM, Morrison SJ. Cell-intrinsic differences between stem cells from different regions of the peripheral nervous system regulate the generation of neural diversity. Neuron. 2002;35:643–656. - PubMed
    1. Brannan CI, Perkins AS, Vogel KS, Ratner N, Nordlund ML, Reid SW, Buchberg AM, Jenkins NA, Parada LF, Copeland NG. Targeted disruption of the neurofibromatosis type-1 gene leads to developmental abnormalities in heart and various neural crest-derived tissues. Genes and Development. 1994;8:1019–1029. - PubMed
    1. Britsch S, Goerich DE, Riethmacher D, Peirano RI, Rossner M, Nave K-A, Birchmeier C, Wegner M. The transcription factor Sox10 is a key regulator of peripheral glial development. Genes and Development. 2001;15:66–78. - PMC - PubMed
    1. Cichowski K, Shih TS, Schmitt E, Santiago S, Reilly K, McLaughlin ME, Bronson RT, Jacks T. Mouse models of tumor development in neurofibromatosis type 1. Science. 1999;286:2172–2176. - PubMed

Publication types

MeSH terms

Substances