. 2008 Feb;13(2):167-80.
doi: 10.1016/j.ccr.2008.01.007.

AID-dependent activation of a MYC transgene induces multiple myeloma in a conditional mouse model of post-germinal center malignancies

Affiliations

AID-dependent activation of a MYC transgene induces multiple myeloma in a conditional mouse model of post-germinal center malignancies

Marta Chesi et al. Cancer Cell. 2008 Feb.

Abstract

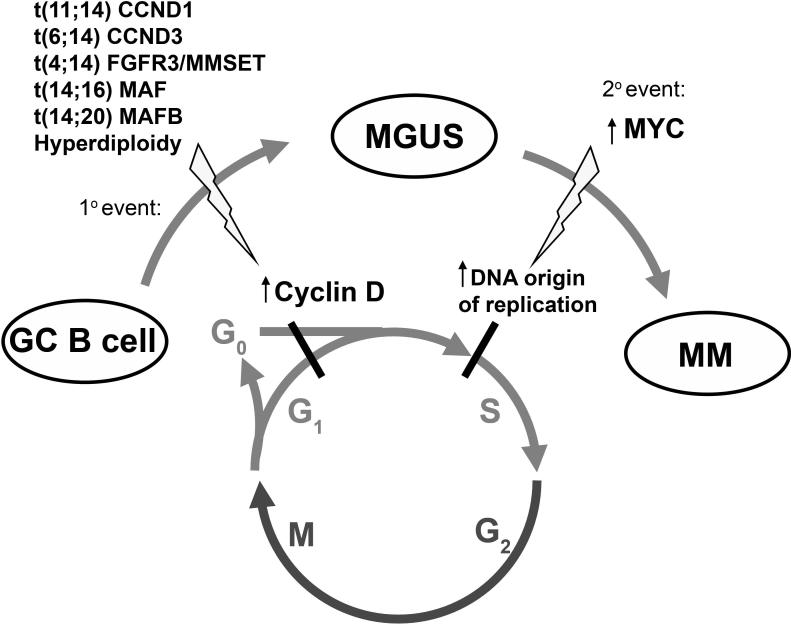
By misdirecting the activity of Activation-Induced Deaminase (AID) to a conditional MYC transgene, we have achieved sporadic, AID-dependent MYC activation in germinal center B cells of Vk*MYC mice. Whereas control C57BL/6 mice develop benign monoclonal gammopathy with age, all Vk*MYC mice progress to an indolent multiple myeloma associated with the biological and clinical features highly characteristic of the human disease. Furthermore, antigen-dependent myeloma could be induced by immunization with a T-dependent antigen. Consistent with these findings in mice, more frequent MYC rearrangements, elevated levels of MYC mRNA, and MYC target genes distinguish human patients with multiple myeloma from individuals with monoclonal gammopathy, implicating a causal role for MYC in the progression of monoclonal gammopathy to multiple myeloma.


Figures

Figure 1
Figure 1. Generation and regulation of matching Vk- and Vk*MYC mice
A) Schematic representation of the Vk-MYC and Vk*MYC vectors. Displayed is a rearranged Vk21 gene in which the Jk5 exon has been replaced by a short coding exon containing a Kozak ATG, and the Ck region has been replaced by a genomic portion of human MYC (exons 2 and 3). Transcription initiates at the Vk21E proximal promoter (arrow), extends to the leader (L) and Vk (V) exons, splices in frame to hMYC and terminates at the endogenous polyA signal (shown). Open and black boxes represent non-coding and coding exons, respectively, including MYC exon 2 and −3. Diagram is not drawn to scale. Asterisks show ATG codons in the leader (L) exon mutated into ACG to avoid premature initiation of translation. The spatial configuration of the Vk locus has been maintained and the open circles indicate the two regulatory regions: intronic enhancer (ie) and 3' kappa enhancer (3'kE). In the ORF close up panel is shown nucleotide and amino acid sequence of the first coding exon: the initiation of translation ATG; the TCG>TAG mutated stop codon is boxed, and the DGYW (AGTA) nucleotide sequence, hot spot for SHM, is underlined. B) Only CMV- but not CMV*-constructs express a transgenic MYC protein. 293T cells have been transfected with CMV*- and CMV-MYC constructs, in which the Vk promoter has been replaced by the CMV promoter active in 293T. Total proteins have been analyzed by Western blot for human MYC (upper) and beta actin (lower). The lower bands in the MYC blot represent the endogenous MYC protein expressed by 293T cells. C) Southern blot on tail DNA from Vk*MYC founders identify 20 and 8 transgene copies in Vk*MYC11 and −24, respectively (lower bands). Top bands represent the endogenous 3'kE locus. The transgene integration site is detected in the Vk*MYC24 founder (middle band). D) Transgenic mRNA expression in Vk*MYC mice. Splenocytes from 6−8 weeks old WT and Vk*MYC mice have been assayed on day 0 (-) or after culturing for four days in the presence of LPS (+) to induce PC differentiation. Total RNA from various transgenic tissues was isolated and probed for human MYC. As positive and negative controls, RNA from human myeloma cell lines with (SKMM2) or without (U266) MYC rearrangements was assayed. As a loading control, the 28S rRNA is shown in the lower panel.
Figure 2
Figure 2. Clonal PC expansion in Vk*MYC mice
A) BM sections from 18 month old WT and Vk*MYC mice were double stained with H&E, MYC/CD138, and Ki67/CD138. Arrowhead indicates a rare Ki67+ PC. All images are of the same magnification and scale bar is shown. B) Nucleated BM cells from spleen and BM of aged matched WT and Vk*MYC mice were analyzed by FCM. Numbers represent percentage of cells within each gate. C) SPEP was performed on a representative WT and a Vk*MYC mouse serially bled at the indicated weeks. The position of the albumin is indicated and brackets show the different globulin components of the serum. Arrowhead emphasizes M-spike in Vk*MYC mouse. D) Incidence of spikes over time (weeks) in a cohort of 40 WT, 60 Vk*MYC, 15 WT immunized and 15 Vk*MYC immunized mice. E) Total levels of serum IgG (g/l) in 70 weeks old WT (n=14) and Vk*MYC (n=28) mice, measured by ELISA. Median is 3.22 and 15.33 g/l, respectively (P<0.0001). F) Co-migration of M-spike (red arrow) detected by SPEP on a donor Vk*MYC mouse and two independent sets of recipient mice following a first (P1) and second (P2) serial transplant of BM mononuclear cells. Flow cytometry detects CD138+B220 PCs in the BM of P1 recipient mice at the time of second transplant (right). Representative results of three independent sets of transplants are shown.
Figure 3
Figure 3. Target organ damage in Vk*MYC mice
A) Hemoglobin levels in peripheral blood from 20 aged WT (median 13.8 g/dl), 34 Vk*MYC (10.05) and 14 Vk*MYC×EμBCL2 (7.95) mice. The P value is indicated. B) Protein deposition in tubuli and glomeruli is evident in H&E stained kidney sections from Vk*MYC mice, but not in WT control and an example is highlighted by an arrowhead. Scale bar is shown. C) X-Ray on spine and femurs from WT and Vk*MYC mice. White arrows point to evident bone lytic lesions and inter–vertebral spinal compression in a Vk*MYC mouse affected by hind limb paralysis. D) Reduced bone mineral density and trabecular number (by MicroCT) in Vk*MYC mice (n=5) compared to age and sex matched WT mice (n=3). +/− Standard deviation is indicated. E) Response of Vk*MYC mice to clinically active or inactive drugs is shown as variation in M-spike intensity over time after the indicated weeks of treatment, compared to baseline levels (100%). Error bars indicate standard deviation. F) Overall survival in days of a cohort of 94 WT, 15 WT immunized, 122 Vk*MYC, 15 Vk*MYC immunized, 24 EμBCL2 and 25 Vk*MYCxEμBCL2 mice. Median survival in days and P values are shown.
Figure 4
Figure 4. BM independent PC growth in Vk*MYC×EμBCL2 mice
A) Spleen sections from aged WT, EμBCL2, Vk*MYC, Vk*MYC immunized and Vk*MYC×EμBCL2 mice were stained with anti-CD138 antibody to identify PCs. In the lower panel is shown flow cytometric analysis on the same tissues. Numbers represent cell percentage within each gate. All images are of the same magnification and size bar is shown. A zoomed-in insert of CD138+ PCs is shown. B) SPEP identified pronounced M-spikes in Vk*MYC, Vk*MYC immunized and Vk*MYC×EμBCL2 mice, but not in WT or EμBCL2.
Figure 5
Figure 5. MM in Vk*MYC mice are AID dependent and can be induced by immunization in an antigen-specific manner
A) Sera collected from non-immunized 50 weeks old Vk*MYC mice, and from Vk*MYC mice two weeks after secondary NP-immunization were analyzed by SPEP (top panel). In parallel, SPEP gel was blotted onto a filter pre-incubated with NP-biotinylated to identify NP reactive Igs (Lower panel). Brackets identify M-spikes; arrowhead points to NP-specific ones. B) Sera from 50 weeks old Vk*MYC×AIDhet and Vk*MYC×AIDnull mice were analyzed by SPEP. C) BM section from 50 weeks old Vk*MYC×AIDnull mouse double stained with MYC/CD138 specific antibodies. Only few PCs are detected, all MYC negative. Scale bar is shown.
Figure 6
Figure 6. Progression from MGUS to MM is associated with over-expression of MYC and MYC target genes
A) All the gene-sets directly associated with MYC activation (highlighted in red), cell cycle and proliferation (highlighted in blue) and relevant to previous experiment comparing MM to MGUS (highlighted in grey) available in the MSigDB database utilized for GSEA, regardless of whether they are significantly enriched, are selected and presented in the table. These are extracted from the complete list of gene-sets (N=687) used for the analysis (see table S1). The overall rank of these gene-sets in relation to the complete list is also presented. Among these gene-sets, those in bold and above the horizontal line are significantly enriched (p < 0.05 and q < 0.05). B) This heatmap represents the expression of genes constituting the MYC signature in normal peripheral blood B-cells (BC), chronic lymphocytic leukemia (CLL), Burkitt's lymphoma (BL), MGUS, MM, Waldenstrom Macroglobulinemia (WM) and normal plasma cells (PC). The samples are arrange by diagnosis and ascending MYC index. On the heatmap, red indicate over-expression, blue under-expression and white median expression. The scaling of the heatmap is indicated by the color bar underneath the heatmap. C) MYC expression and the MYC index are represented as a dot-plot according to the different cell / disease type shown in fig 6B. The horizontal red line represents the mean value. The standard deviation (SD) is indicated.
Figure 7
Figure 7. Step-wise dysregulation of early cell cycle checkpoints during MGUS and MM evolution (proposed model)
An early event in MM is over-expression of a cyclin D gene as the result of a primary mutation (translocation or hyperdiploidy). Cyclin D over-expression in PCs presumably enables these cells to autonomously overcome the early G0G1 checkpoint, contributing to limited clonal PC expansion (MGUS). Over-expression of MYC is one secondary event that may eliminate remaining cell cycle constraints. Significantly, it was recently demonstrated that MYC is directly involved in DNA replication, binding and activating DNA replicative origins and regulating progression of cells into S-phase (Dominguez-Sola et al., 2007). Therefore, we propose that MYC dysregulation is an important progression event between MGUS and MM and mechanistically circumvents cell cycle constraints remaining in cells over-expressing cyclin D by promoting transit into the DNA synthesis S-phase through increased DNA replicative origin activity.

References

    1. Adams JM, Harris AW, Pinkert CA, Corcoran LM, Alexander WS, Cory S, Palmiter RD, Brinster RL. The c-myc oncogene driven by immunoglobulin enhancers induces lymphoid malignancy in transgenic mice. Nature. 1985;318:533–538. - PubMed
    1. Alexanian R, Barlogie B, Dixon D. High-dose glucocorticoid treatment of resistant myeloma. Ann Intern Med. 1986;105:8–11. - PubMed
    1. Allen SL, Coleman M. Aggressive phase multiple myeloma: a terminal anaplastic transformation resembling high-grade lymphoma. Cancer Invest. 1990;8:417–424. - PubMed
    1. Avet-Loiseau H, Attal M, Moreau P, Charbonnel C, Garban F, Hulin C, Leyvraz S, Michallet M, Yakoub-Agha I, Garderet L, et al. Genetic abnormalities and survival in multiple myeloma: the experience of the Intergroupe Francophone du Myelome. Blood. 2007;109:3489–3495. - PubMed
    1. Avet-Loiseau H, Gerson F, Magrangeas F, Minvielle S, Harousseau JL, Bataille R. Rearrangements of the c-myc oncogene are present in 15% of primary human multiple myeloma tumors. Blood. 2001;98:3082–3086. - PubMed

Publication types

MeSH terms

Substances