Review
. 2008 May;94(1):16-37.
doi: 10.1016/j.ymgme.2007.11.018. Epub 2008 Feb 1.

The in-depth evaluation of suspected mitochondrial disease

Affiliations
Review

The in-depth evaluation of suspected mitochondrial disease

Mitochondrial Medicine Society's Committee on Diagnosis et al. Mol Genet Metab. 2008 May.

Abstract

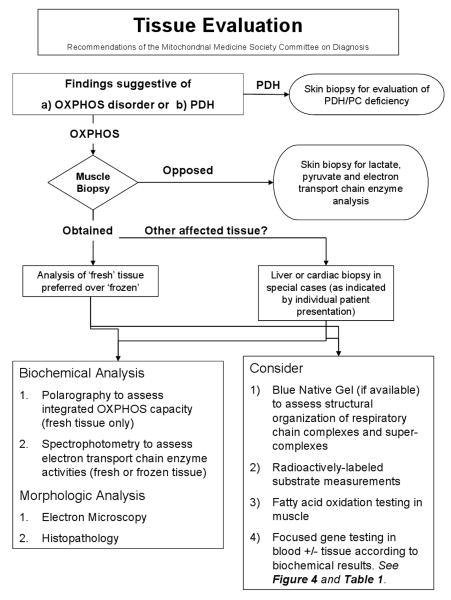
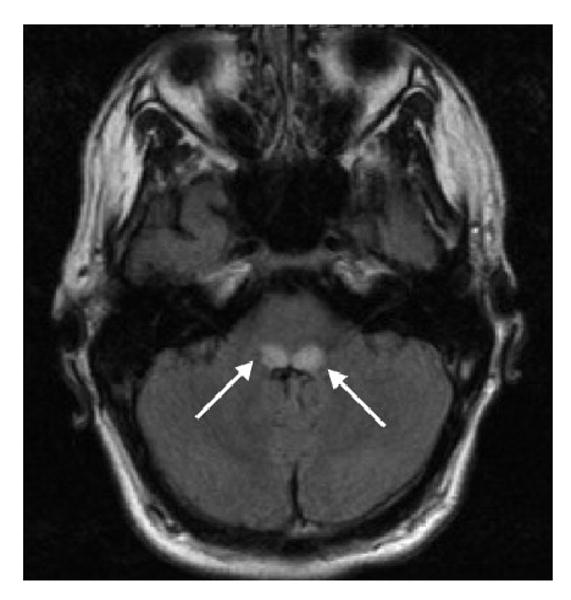
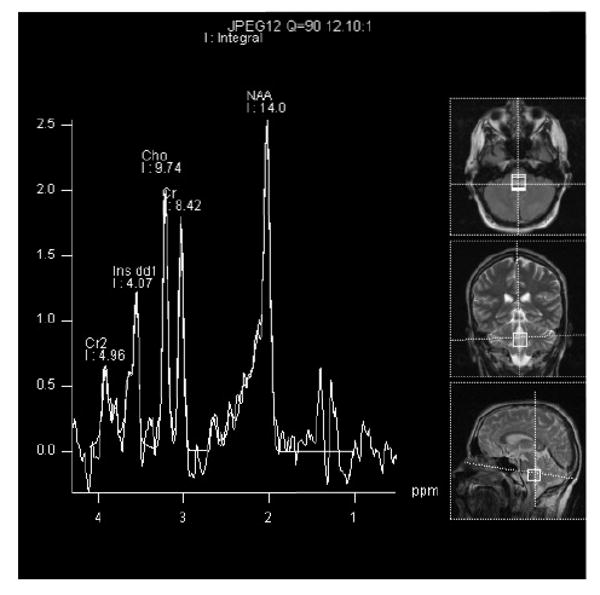
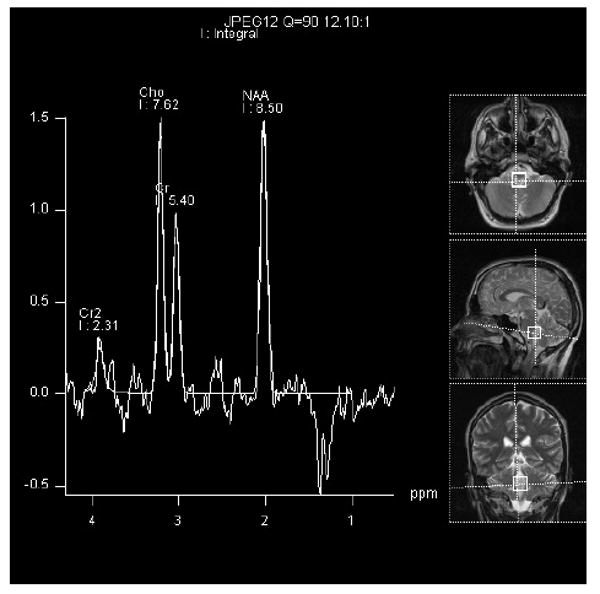
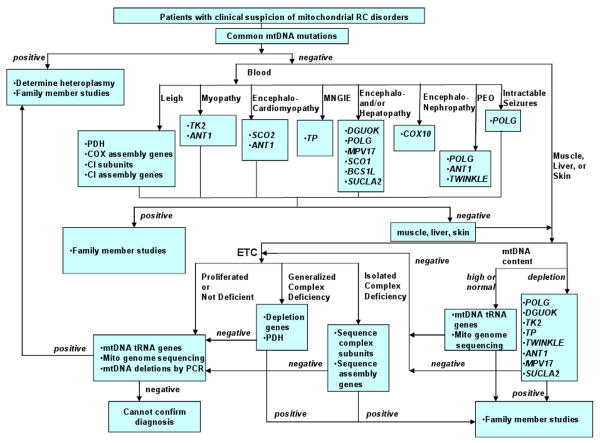
Mitochondrial disease confirmation and establishment of a specific molecular diagnosis requires extensive clinical and laboratory evaluation. Dual genome origins of mitochondrial disease, multi-organ system manifestations, and an ever increasing spectrum of recognized phenotypes represent the main diagnostic challenges. To overcome these obstacles, compiling information from a variety of diagnostic laboratory modalities can often provide sufficient evidence to establish an etiology. These include blood and tissue histochemical and analyte measurements, neuroimaging, provocative testing, enzymatic assays of tissue samples and cultured cells, as well as DNA analysis. As interpretation of results from these multifaceted investigations can become quite complex, the Diagnostic Committee of the Mitochondrial Medicine Society developed this review to provide an overview of currently available and emerging methodologies for the diagnosis of primary mitochondrial disease, with a focus on disorders characterized by impairment of oxidative phosphorylation. The aim of this work is to facilitate the diagnosis of mitochondrial disease by geneticists, neurologists, and other metabolic specialists who face the challenge of evaluating patients of all ages with suspected mitochondrial disease.


Figures

Figure 1
Figure 1
The in-depth laboratory evaluation of suspected primary mitochondrial disease involves both minimally-invasive and invasively obtained specimens. Figure 1a. Analyte analyses of plasma, urine, and CSF samples may identify abnormalities suggestive of mitochondrial disease. Figure 1b. Overview of tissue-based evaluations in suspected primary mitochondrial respiratory chain disease.
Figure 1
Figure 1
The in-depth laboratory evaluation of suspected primary mitochondrial disease involves both minimally-invasive and invasively obtained specimens. Figure 1a. Analyte analyses of plasma, urine, and CSF samples may identify abnormalities suggestive of mitochondrial disease. Figure 1b. Overview of tissue-based evaluations in suspected primary mitochondrial respiratory chain disease.
Figure 2
Figure 2
Brain MRI demonstrating an axial FLAIR sequence of a 17-year-old boy with new-onset respiratory difficulty, episodic vomiting, and extreme fatigue. This figure represents the symmetric regions of elevated T2/FLAIR signal located within the tegmentum (arrows). The diagnosis was Leigh syndrome.
Figure 3
Figure 3
Figure 3A. This brain MRS scan represents a 1.6 × 1.6 cm voxel within the hyperintense FLAIR signal region. The exact location can be seen on the MRI images represented on the right of the picture. The time to echo (TE) was 35 msec. There is a upward lactate peak (Lac) located at 1.33 ppm, N-acetyl-L-aspartate (NAA) peak at 2.02 ppm, total creatine peak (Cr) at 3.03 ppm, choline peak (Cho) at 3.2 ppm, and inositol peak (Ins) at 3.8 ppm. It is likely that the voxel may include some cerebral spinal fluid. There was no detectable lactate in the cerebral spinal fluid several days before the image was acquired. Figure 3b. This MRS scan represents the same 1.6 × 1.6 cm voxel as figure 3A. The time to echo (TE) was 135 msec. Notice the downward Lac peak at 1.3 ppm, while the NAA peak at 2.02 ppm, Cr peak at 3.03 ppm, and Cho peak at 3.2 ppm remain upward. At this TE, the Ins peak is not well visualized.
Figure 3
Figure 3
Figure 3A. This brain MRS scan represents a 1.6 × 1.6 cm voxel within the hyperintense FLAIR signal region. The exact location can be seen on the MRI images represented on the right of the picture. The time to echo (TE) was 35 msec. There is a upward lactate peak (Lac) located at 1.33 ppm, N-acetyl-L-aspartate (NAA) peak at 2.02 ppm, total creatine peak (Cr) at 3.03 ppm, choline peak (Cho) at 3.2 ppm, and inositol peak (Ins) at 3.8 ppm. It is likely that the voxel may include some cerebral spinal fluid. There was no detectable lactate in the cerebral spinal fluid several days before the image was acquired. Figure 3b. This MRS scan represents the same 1.6 × 1.6 cm voxel as figure 3A. The time to echo (TE) was 135 msec. Notice the downward Lac peak at 1.3 ppm, while the NAA peak at 2.02 ppm, Cr peak at 3.03 ppm, and Cho peak at 3.2 ppm remain upward. At this TE, the Ins peak is not well visualized.
Figure 4
Figure 4
Clinical algorithm for genetic diagnostic testing of mtDNA and nDNA genes in patients suspected of mitochondrial disorders currently followed by Baylor College of Medicine, Mitochondrial Diagnostics Laboratory. *This algorithm reflects currently available clinical testing and experience of Baylor College of Medicine, Mitochondrial Diagnostics Laboratory.

References

    1. Haas RH, P S, Falk MJ, Saneto RP, Wolf NI, Darin N, Cohen BH. Mitochondrial Disease: A practical approach for primary care physicians. Pediatrics. 2007 in press. - PubMed
    1. Bernier FP, et al. Diagnostic criteria for respiratory chain disorders in adults and children. Neurology. 2002;59(9):1406–11. - PubMed
    1. Wolf NI, Smeitink JA. Mitochondrial disorders: a proposal for consensus diagnostic criteria in infants and children. Neurology. 2002;59(9):1402–5. - PubMed
    1. DiMauro S, Hirano M. Mitochondrial encephalomyopathies: an update. Neuromuscul Disord. 2005;15(4):276–86. - PubMed
    1. Gellerich FN, et al. The problem of interlab variation in methods for mitochondrial disease diagnosis: enzymatic measurement of respiratory chain complexes. Mitochondrion. 2004;4(56):427–39. - PubMed

MeSH terms