. 2008 Mar 15;315(2):552-66.
doi: 10.1016/j.ydbio.2007.12.018. Epub 2008 Feb 20.

Krüppel-like factor 4 is involved in functional differentiation of testicular Sertoli cells

Affiliations

Krüppel-like factor 4 is involved in functional differentiation of testicular Sertoli cells

Maren Godmann et al. Dev Biol. .

Abstract

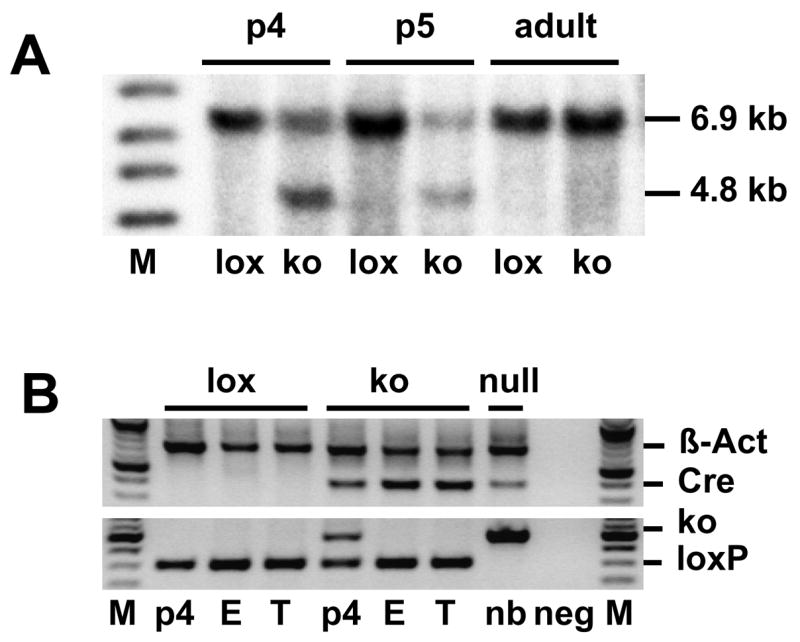
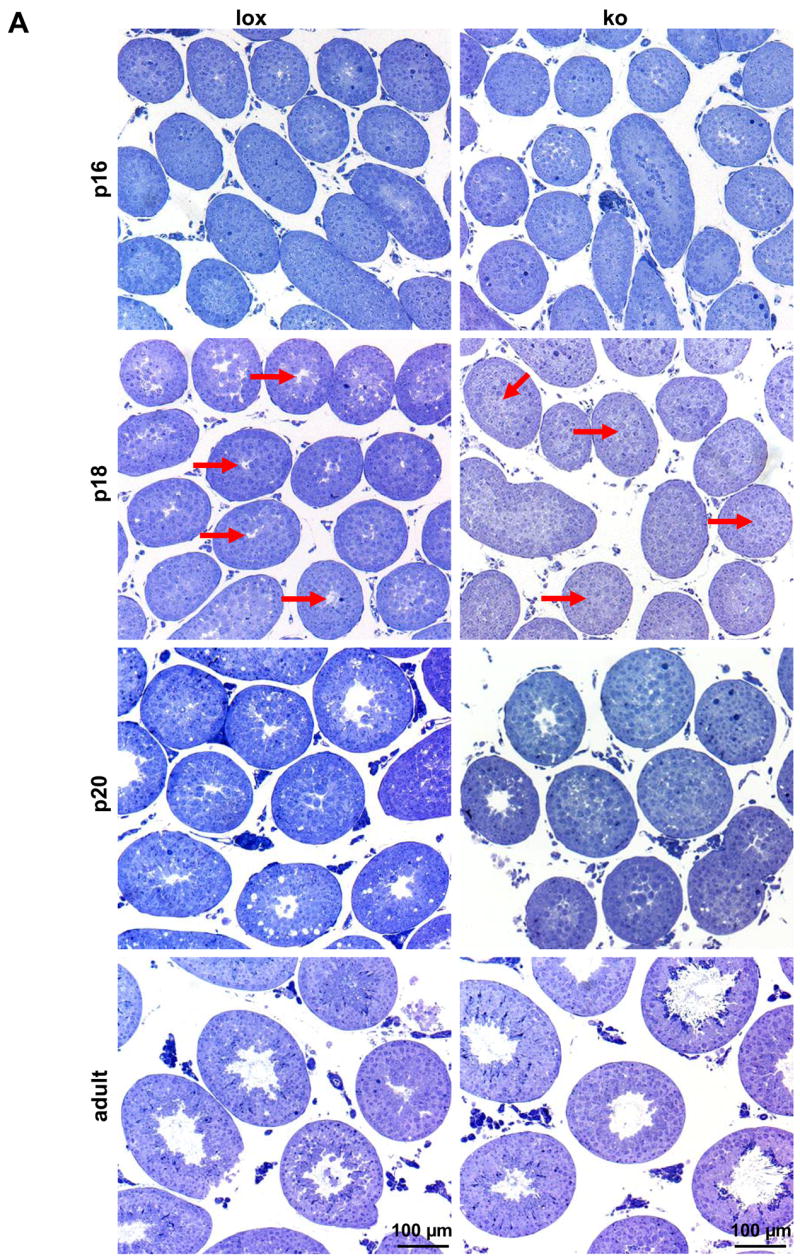
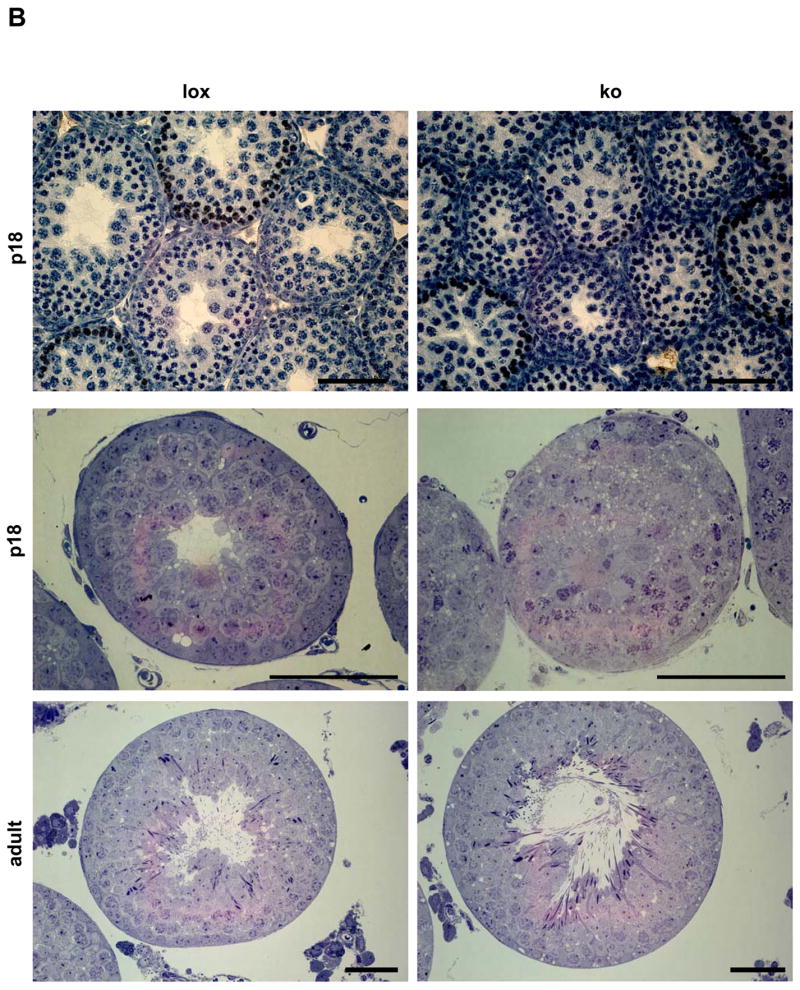
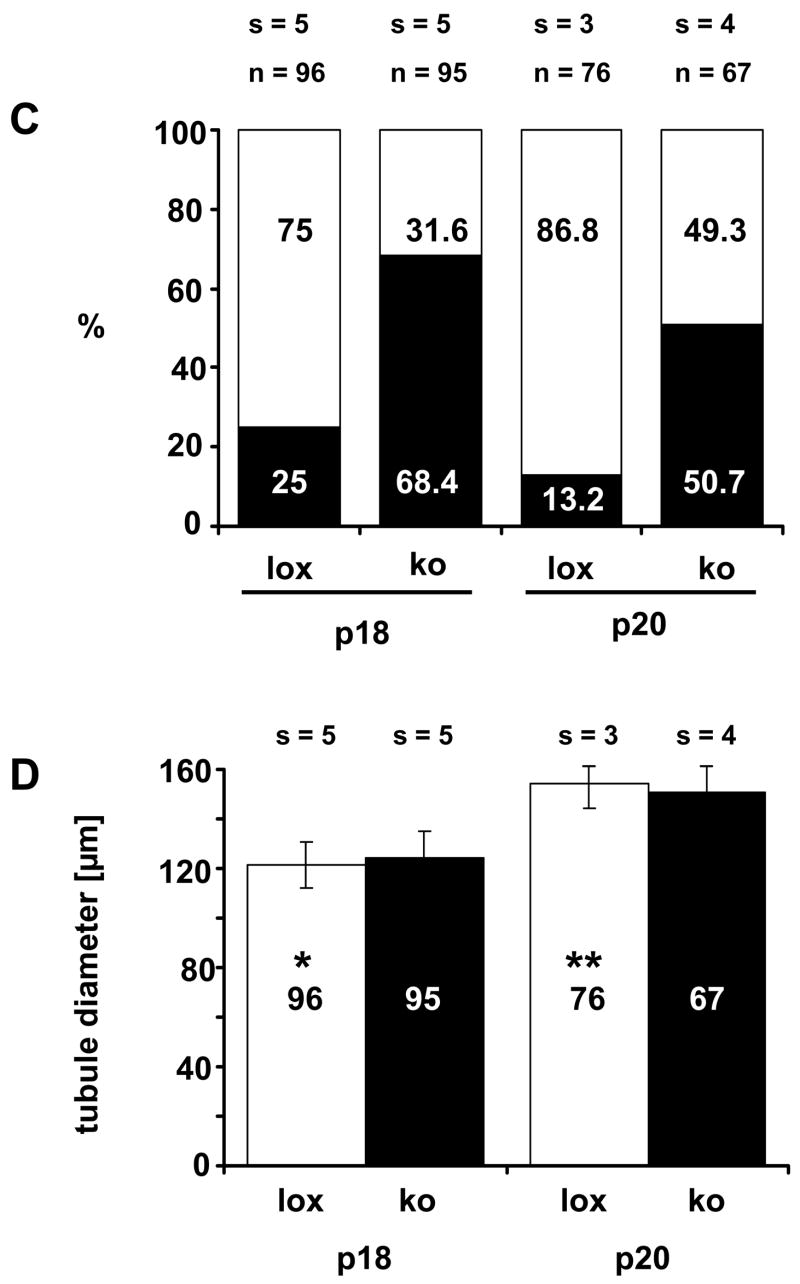
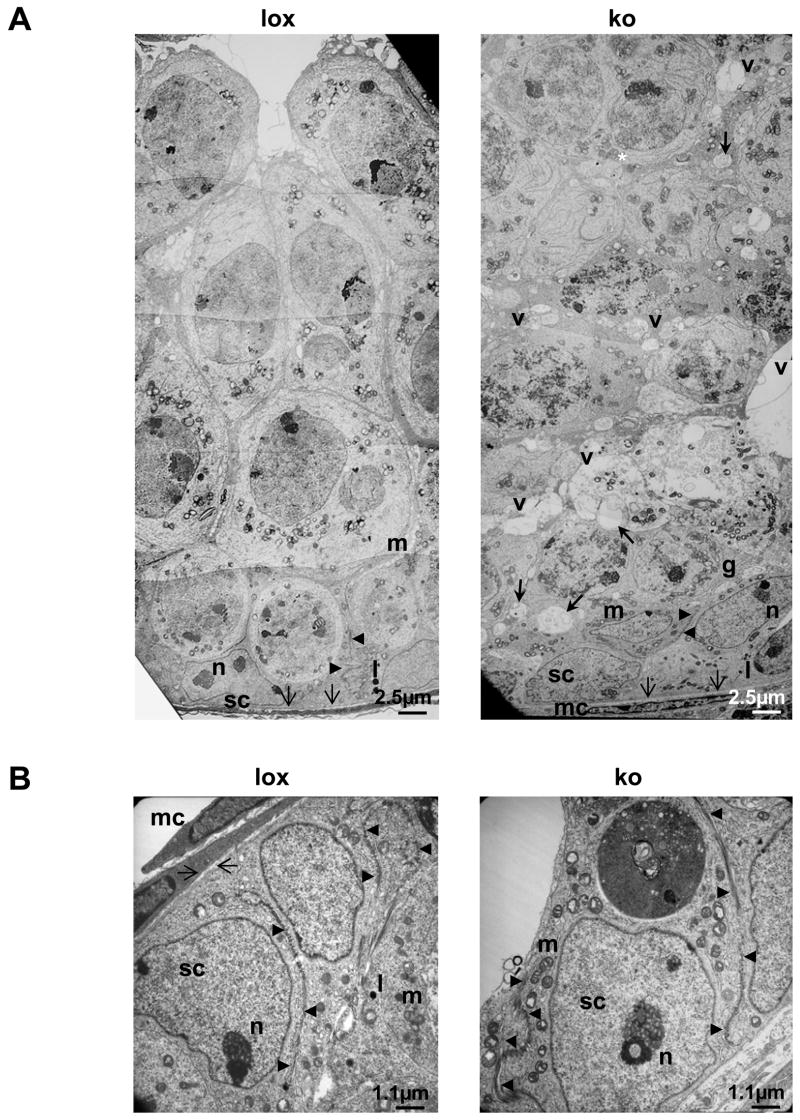
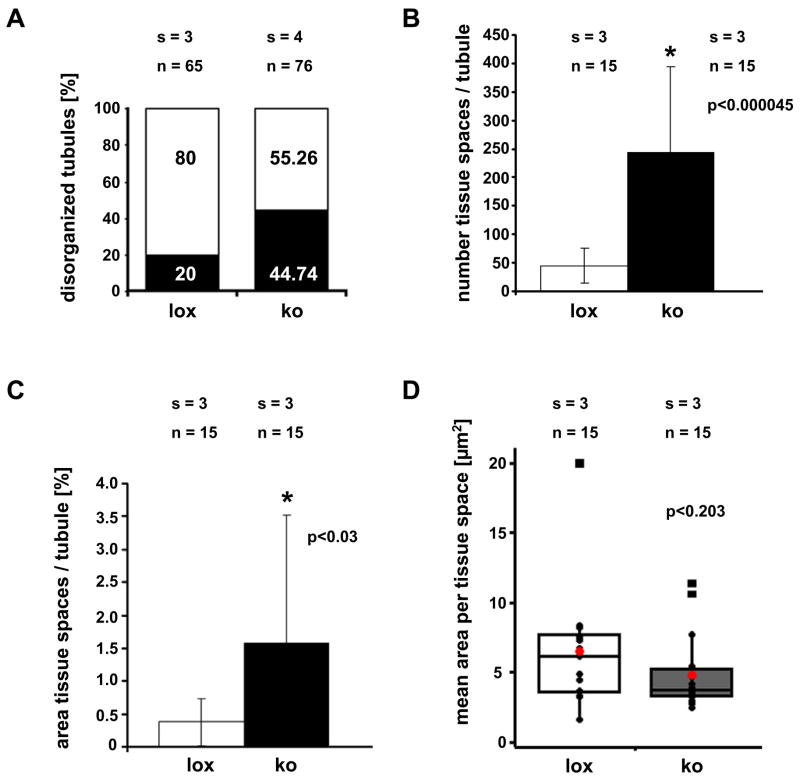
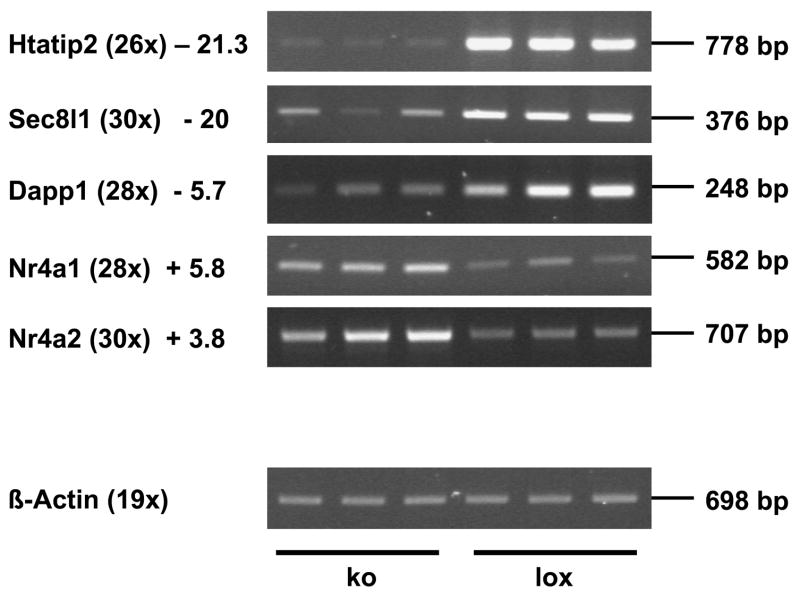
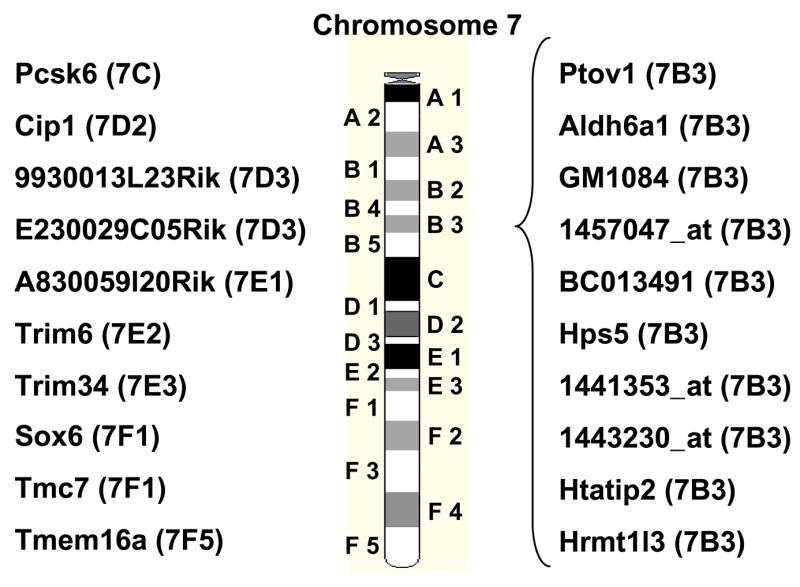
Krüppel-like factor 4 (KLF4) is a pleiotropic zinc finger transcription factor that regulates genes being involved in differentiation and cell-cycle control. Knockout studies revealed a critical function for KLF4 in the terminal differentiation of many epithelial cells. In testicular Sertoli cells, Klf4 is strongly inducible by the glycoprotein follicle stimulating hormone (FSH). Because KLF4 is essential for postnatal survival in mice, we deleted Klf4 specifically in Sertoli cells using the Cre/loxP system. Importantly, around postnatal day 18, a critical period of terminal Sertoli cell differentiation, mutant seminiferous tubules exhibited a disorganized germinal epithelium and delayed lumen formation. The ultrastructural finding of highly vacuolized Sertoli cell cytoplasm and the identification of differentially expressed genes, which are known to play roles during vesicle transport and fusion or for maintenance of the differentiated cell state, suggest impaired apical secretion of the Sertoli cell. Interestingly, a high proportion of all identified genes was localized in a small subregion of chromosome 7, suggesting coordinated regulation. Intriguingly, adult mutant mice are fertile and show normal testicular morphology, although the testosterone levels are decreased. In summary, KLF4 plays a significant role for proper and timely Sertoli cell differentiation in pubertal mice.


Figures

Figure 1
Figure 1
Sertoli cell-specific homologous recombination in testes of AMH-Cre/Klf4loxP/loxP mice. (a) Genomic Southern blot on DNA isolated from mutant (ko) and control (lox) testes from p4, p5 and adult mice, respectively. The 6.9 kb fragment represents the undeleted loxP allele and the 4.8 kb fragment indicates deletion of exons 2, 3, and 4 of the Klf4 gene. In control testes only the 6.9 kb band can be detected, while Cre-positive animals also exhibit the smaller 4.8 kb band. (b) Genotyping-PCR on genomic DNA isolated from p4 testis, adult epididymis (E) and tips of tails (T) from AMH-Cre/Klf4loxP/loxP mice (ko) and Cre-negative control mice (lox). This PCR confirmed that recombination did not occur in germ cells as DNA from adult epididymis (including all sperm cells stored in this organ) did not exhibit the band indicating recombination in these cells. The upper band in the upper panel shows β-Actin as an internal control. The lower band in the upper panel indicates Cre recombinase expression. The lower panel shows the Klf4 genotyping. M: size marker; p4: postnatal day 4 testis; E: epididymis; T: tail; neg: PCR without genomic DNA; null: Klf4 was deleted constitutively in all cells in a new born (nb) mouse.
Figure 2
Figure 2
(a) Testicular histology of AMH-Cre/Klf4loxP/loxP mice (ko) on semi-thin sections during the phase of terminal differentiation of Sertoli cells (postnatal day 16 (p16)–20 (p20)) and in adulthood compared to their control (lox) littermates. Red arrows point at the centers of p18 tubules, which are mainly open in controls but still closed in most mutants. (b) Top panel: A typical control and a mutant testis at p18 after fixation in Bouin’s solution. Basically the same situation can be seen as in semi-thin sectioned tissues: most of the tubules in the control are open at p18 while the majority of the tubules in the mutants are still closed. For more details please see results. Middle panel: A typical p18 tubule of a mutant and a control testis. The control shows a regularly ordered germinal epithelium and an established lumen. Relatively few tissue spaces are present. In contrast, the mutant tubule exhibits numerous vacuoles and no lumen. Also, the mutant epithelium appears to be disorganized. Bottom panel: Semi-thin sections of typical tubules from a mutant and a control testis. Both tubules show a normally arranged epithelium and a lumen. The adult mutant tubule does not exhibit increased vacuolization. The bar represents in all pictures 50 μm. (c) Quantification of the percentage (%) of open (white bar) and closed tubules (black bar) in p18 and p20 testes from control (lox) and mutant (ko) mice. Numbers on the bars indicate the percentage (%), numbers above the bars indicate the numbers (n) of analysed tubules and the number (s) of evaluated testis samples. (d) Quantification of the diameter of the tubules in p18 and p20 testes from control (lox, white bars) and mutant (ko, black bars) mice. While in p18 testes the mutant tubules had a slightly, yet significantly increased diameter, at p20 the mutant tubules showed a significantly reduced diameter. Only strictly circular cross sections (smallest diameter at least 98% of the largest diameter) were selected for analysis to exclude the possibility of evaluating sagittal sections. Numbers of the analyzed tubules are indicated on the bar and numbers (s) above the bar refer to the evaluated testis samples. Results were expressed as the mean ± SD as indicated by error bars. *p<0.033, **p<0.043.
Figure 2
Figure 2
(a) Testicular histology of AMH-Cre/Klf4loxP/loxP mice (ko) on semi-thin sections during the phase of terminal differentiation of Sertoli cells (postnatal day 16 (p16)–20 (p20)) and in adulthood compared to their control (lox) littermates. Red arrows point at the centers of p18 tubules, which are mainly open in controls but still closed in most mutants. (b) Top panel: A typical control and a mutant testis at p18 after fixation in Bouin’s solution. Basically the same situation can be seen as in semi-thin sectioned tissues: most of the tubules in the control are open at p18 while the majority of the tubules in the mutants are still closed. For more details please see results. Middle panel: A typical p18 tubule of a mutant and a control testis. The control shows a regularly ordered germinal epithelium and an established lumen. Relatively few tissue spaces are present. In contrast, the mutant tubule exhibits numerous vacuoles and no lumen. Also, the mutant epithelium appears to be disorganized. Bottom panel: Semi-thin sections of typical tubules from a mutant and a control testis. Both tubules show a normally arranged epithelium and a lumen. The adult mutant tubule does not exhibit increased vacuolization. The bar represents in all pictures 50 μm. (c) Quantification of the percentage (%) of open (white bar) and closed tubules (black bar) in p18 and p20 testes from control (lox) and mutant (ko) mice. Numbers on the bars indicate the percentage (%), numbers above the bars indicate the numbers (n) of analysed tubules and the number (s) of evaluated testis samples. (d) Quantification of the diameter of the tubules in p18 and p20 testes from control (lox, white bars) and mutant (ko, black bars) mice. While in p18 testes the mutant tubules had a slightly, yet significantly increased diameter, at p20 the mutant tubules showed a significantly reduced diameter. Only strictly circular cross sections (smallest diameter at least 98% of the largest diameter) were selected for analysis to exclude the possibility of evaluating sagittal sections. Numbers of the analyzed tubules are indicated on the bar and numbers (s) above the bar refer to the evaluated testis samples. Results were expressed as the mean ± SD as indicated by error bars. *p<0.033, **p<0.043.
Figure 3
Figure 3
(a) Ultrastructural analysis of the germinal epithelium at postnatal day 18 (p18) in AMH-Cre/Klf4loxP/loxP and control mice by transmission electron microscopy (2500x). The germinal epithelium is shown from the basal lamina (arrows at the bottom) up to the center of the tubule in controls (lox) and mutant mice (ko). While most tubules in the controls had developed a lumen (upper part of the left picture) and exhibit a properly ordered epithelium, the mutant tubule appears disorganized. Cell boundaries are hardly visible and no lumen had formed in the center of the tubule (asterisk). Moreover, numerous vacuoles (v) delimited by membranous structures can be seen (bold arrows). The blood-testis barrier appears to be normal in both genotypes (arrow heads). (b) Higher magnification (6000x) of the basal part of the germinal epithelium in AMH-Cre/Klf4loxP/loxP (ko) and control mice (lox) confirms that the blood-testis-barrier (arrow heads) has been formed at p18 in control (lox) and mutant (ko) mice. G: Golgi apparatus; l: lysosome; m: mitochondria; mc: myoid cell; n: nucleolus; sc: Sertoli cell; v: vacuole.
Figure 4
Figure 4
Quantitative histological analyses of semi-thin sectioned tissues at postnatal day 18 (p18) in mutant (ko) and control (lox) mice. (a) Percentage (%) of normally structured (white bar) and disorganized tubules (black bar) in p18 testes from control (lox) and mutant (ko) mice. (b) Quantification of the number of tissue spaces per circular cross section in control (lox) and mutant (ko) testes. The mutant testes show a significantly (p > 0.000045) higher number of tissue spaces as defined in materials and methods. (c) Percentage (%) of the area covered by tissue spaces in the germinal epithelium of p18 control (lox) and mutant (ko) testes. A centrally located lumen was excluded from the calculation. The area of the germinal epithelium covered by tissue spaces is significantly (p < 0.03) higher in the mutants than in the controls. (d) The mean area of tissue spaces per circular tubule’s cross section in mutants and controls. Each black circle in this box plot diagram represents a data point. The mean area covered by each tissue space is not significantly (p < 0.203) different between mutants and controls. Mean values are shown as red circles, vertical bars indicate SD. Black squares depict outliers as classified by Minitab 15 software (State College PA, USA). (n) Number of analyzed circular tubule’s cross sections, (s) number of evaluated tissue samples. Results were expressed as the mean ± SD. P values are given in each figure and statistical significance is indicated by asterisks.
Figure 5
Figure 5
Verification of the changed expression of selected genes in mutant testes by RT-PCR. Reduced expression of Htatip2, Sec8l1, and Dapp1 was confirmed as well as increased abundance of the mRNAs for the nuclear orphan receptors Nr4a1 and Nr4a2. β-Actin was used as internal control. Fold changes revealed by microarray analyses are shown next to the corresponding gene. Numbers in parentheses indicate the numbers of PCR cycles. Bp: base pair; ko: AMH-Cre/Klf4loxP/loxP; lox: control mice (Klf4loxP/loxP).
Figure 6
Figure 6
A very high proportion of regulated genes in mutant mice is localized on chromosome 7. Twenty of the 51 genes identified by microarray analysis are localized on chromosome 7 and, furthermore, 10 genes are localized within the small subregion B3. Subregions are shown in parentheses.

Similar articles

Cited by

References

    1. Allam A, Niiro H, Clark EA, Marshall AJ. The adaptor protein Bam32 regulates Rac1 activation and actin remodeling through a phosphorylation-dependent mechanism. J Biol Chem. 2004;279:39775–82. - PubMed
    1. Anderson KE, Lipp P, Bootman M, Ridley SH, Coadwell J, Ronnstrand L, Lennartsson J, Holmes AB, Painter GF, Thuring J, Lim Z, Erdjument-Bromage H, Grewal A, Tempst P, Stephens LR, Hawkins PT. DAPP1 undergoes a PI 3-kinase-dependent cycle of plasma-membrane recruitment and endocytosis upon cell stimulation. Curr Biol. 2000;10:1403–12. - PubMed
    1. Bader MF, Doussau F, Chasserot-Golaz S, Vitale N, Gasman S. Coupling actin and membrane dynamics during calcium-regulated exocytosis: a role for Rho and ARF GTPases. Biochim Biophys Acta. 2004;1742:37–49. - PubMed
    1. Bailey RW, Aronow B, Harmony JA, Griswold MD. Heat shock-initiated apoptosis is accelerated and removal of damaged cells is delayed in the testis of clusterin/ApoJ knock-out mice. Biol Reprod. 2002;66:1042–53. - PubMed
    1. Bartlett JM, Weinbauer GF, Nieschlag E. Differential effects of FSH and testosterone on the maintenance of spermatogenesis in the adult hypophysectomized rat. J Endocrinol. 1989;121:49–58. - PubMed

Publication types

MeSH terms

LinkOut - more resources