

Tor pathway control of the nitrogen-responsive DAL5 gene bifurcates at the level of Gln3 and Gat1 regulation in Saccharomyces cerevisiae
- PMID: 18245087
- PMCID: PMC2276367
- DOI: 10.1074/jbc.M708811200
Tor pathway control of the nitrogen-responsive DAL5 gene bifurcates at the level of Gln3 and Gat1 regulation in Saccharomyces cerevisiae
Abstract
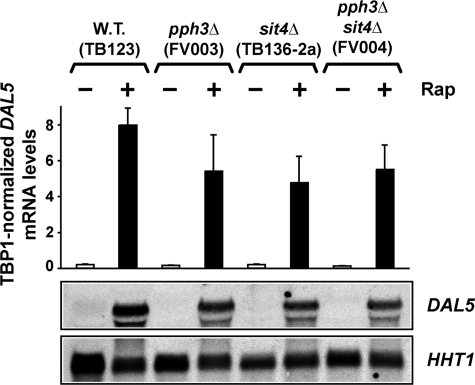
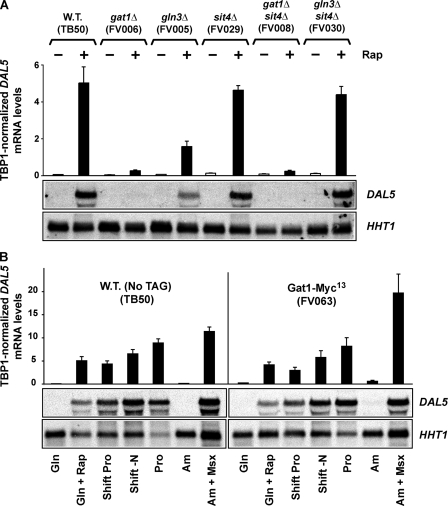
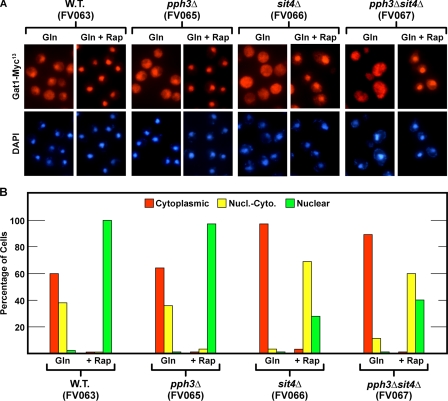
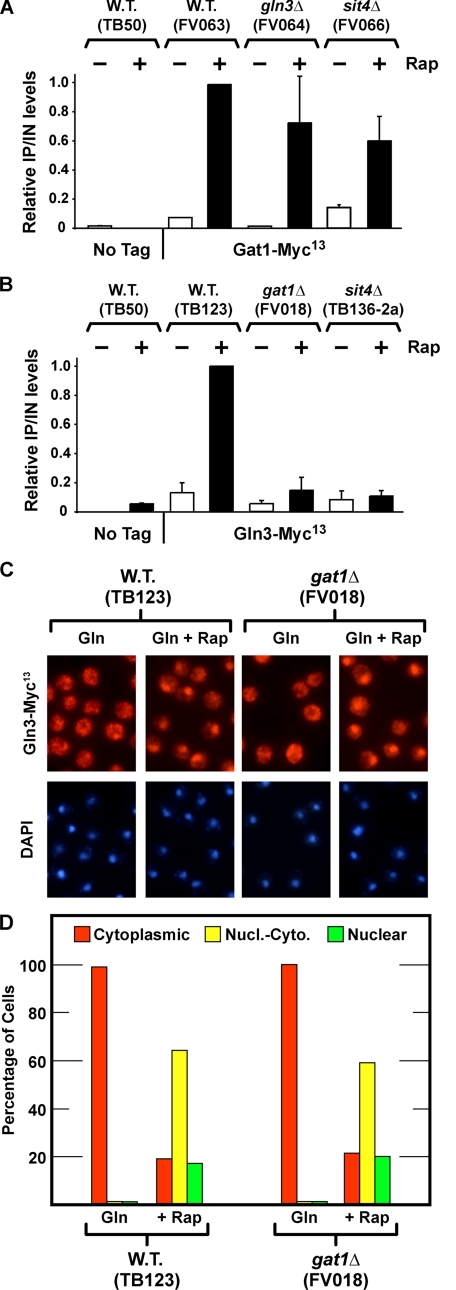
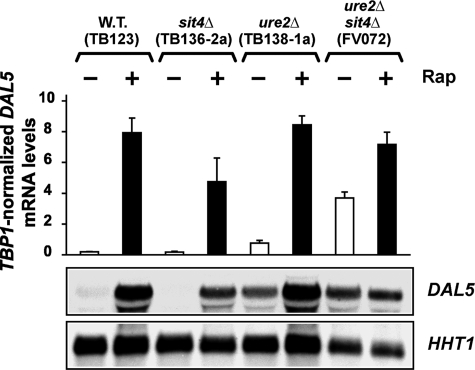
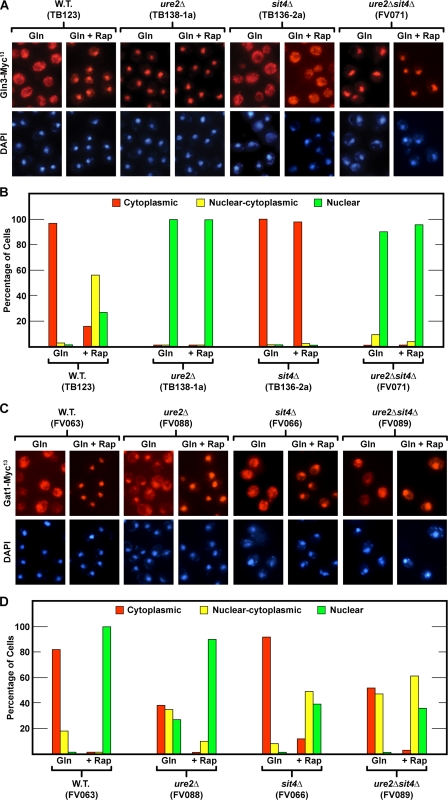
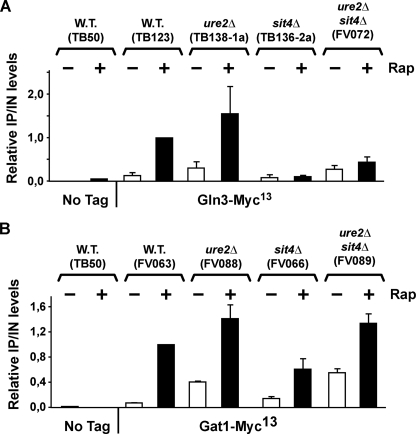
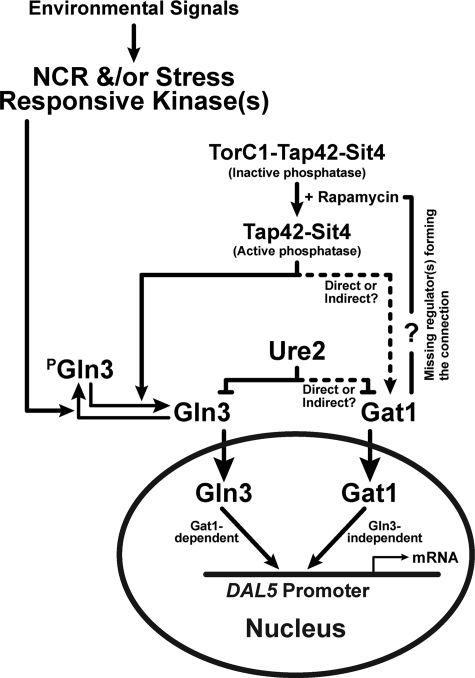
The Tor1,2 protein kinases globally influence many cellular processes including nitrogen-responsive gene expression that correlates with intracellular localization of GATA transcription activators Gln3 and Gat1/Nil1. Gln3-Myc(13) and Gat1-Myc(13) are restricted to the cytoplasm of cells provided with good nitrogen sources, e.g. glutamine. Following the addition of the Tor1,2 inhibitor, rapamycin, both transcription factors relocate to the nucleus. Gln3-Myc(13) localization is highly dependent upon Ure2 and type 2A-related phosphatase, Sit4. Ure2 is required for Gln3 to be restricted to the cytoplasm of cells provided with good nitrogen sources, and Sit4 is required for its location to the nucleus following rapamycin treatment. The paucity of analogous information concerning Gat1 regulation prompted us to investigate the effects of deleting SIT4 and URE2 on Gat1-Myc(13) localization, DNA binding, and NCR-sensitive transcription. Our data demonstrate that Tor pathway control of NCR-responsive transcription bifurcates at the regulation of Gln3 and Gat1. Gat1-Myc(13) localization is not strongly influenced by deleting URE2, nor is its nuclear targeting following rapamycin treatment strongly dependent on Sit4. ChIP experiments demonstrated that Gat1-Myc(13) can bind to the DAL5 promoter in the absence of Gln3. Gln3-Myc(13), on the other hand, cannot bind to DAL5 in the absence of Gat1. We conclude that: (i) Tor pathway regulation of Gat1 differs markedly from that of Gln3, (ii) nuclear targeting of Gln3-Myc(13) is alone insufficient for its recruitment to the DAL5 promoter, and (iii) the Tor pathway continues to play an important regulatory role in NCR-sensitive transcription even after Gln3-Myc(13) is localized to the nucleus.
Figures
Similar articles
-
Intranuclear function for protein phosphatase 2A: Pph21 and Pph22 are required for rapamycin-induced GATA factor binding to the DAL5 promoter in yeast.Mol Cell Biol. 2011 Jan;31(1):92-104. doi: 10.1128/MCB.00482-10. Epub 2010 Oct 25. Mol Cell Biol. 2011. PMID: 20974806 Free PMC article.
-
Nitrogen-responsive regulation of GATA protein family activators Gln3 and Gat1 occurs by two distinct pathways, one inhibited by rapamycin and the other by methionine sulfoximine.J Biol Chem. 2011 Dec 30;286(52):44897-912. doi: 10.1074/jbc.M111.290577. Epub 2011 Oct 28. J Biol Chem. 2011. PMID: 22039046 Free PMC article.
-
Nitrogen catabolite repression-sensitive transcription as a readout of Tor pathway regulation: the genetic background, reporter gene and GATA factor assayed determine the outcomes.Genetics. 2009 Mar;181(3):861-74. doi: 10.1534/genetics.108.099051. Epub 2008 Dec 22. Genetics. 2009. PMID: 19104072 Free PMC article.
-
Transmitting the signal of excess nitrogen in Saccharomyces cerevisiae from the Tor proteins to the GATA factors: connecting the dots.FEMS Microbiol Rev. 2002 Aug;26(3):223-38. doi: 10.1111/j.1574-6976.2002.tb00612.x. FEMS Microbiol Rev. 2002. PMID: 12165425 Free PMC article. Review.
-
Bursting into the nucleus.Sci Signal. 2008 Dec 23;1(51):pe54. doi: 10.1126/scisignal.151pe54. Sci Signal. 2008. PMID: 19109237 Free PMC article. Review.
Cited by
-
gln3 mutations dissociate responses to nitrogen limitation (nitrogen catabolite repression) and rapamycin inhibition of TorC1.J Biol Chem. 2013 Jan 25;288(4):2789-804. doi: 10.1074/jbc.M112.421826. Epub 2012 Dec 5. J Biol Chem. 2013. PMID: 23223232 Free PMC article.
-
Components of Golgi-to-vacuole trafficking are required for nitrogen- and TORC1-responsive regulation of the yeast GATA factors.Microbiologyopen. 2014 Jun;3(3):271-87. doi: 10.1002/mbo3.168. Epub 2014 Mar 18. Microbiologyopen. 2014. PMID: 24644271 Free PMC article.
-
The yeast GATA factor Gat1 occupies a central position in nitrogen catabolite repression-sensitive gene activation.Mol Cell Biol. 2009 Jul;29(13):3803-15. doi: 10.1128/MCB.00399-09. Epub 2009 Apr 20. Mol Cell Biol. 2009. PMID: 19380492 Free PMC article.
-
R2R3-type MYB transcription factor, CmMYB1, is a central nitrogen assimilation regulator in Cyanidioschyzon merolae.Proc Natl Acad Sci U S A. 2009 Jul 28;106(30):12548-53. doi: 10.1073/pnas.0902790106. Epub 2009 Jul 10. Proc Natl Acad Sci U S A. 2009. PMID: 19592510 Free PMC article.
-
Nitrogen regulation of fungal secondary metabolism in fungi.Front Microbiol. 2014 Nov 28;5:656. doi: 10.3389/fmicb.2014.00656. eCollection 2014. Front Microbiol. 2014. PMID: 25506342 Free PMC article. Review.
References
-
- Schluter, M., and Schofer, J. (2005) Am. Heart Hosp. J. 3 182–186 - PubMed
-
- Boulay, A., Rudloff, J., Ye, J., Zumstein-Mecker, S., O'Reilly, T., Evans, D. B., Chen, S., and Lane, H. A. (2005) Clin. Cancer Res. 11 5319–5328 - PubMed
-
- Morgensztern, D., and McLeod, H. L. (2005) Anticancer Drugs. 16 797–803 - PubMed
-
- Lorber, M. I., Mulgaonkar, S., Butt, M., Elkhammas, E., Mendez, R., Rajagopalan, P. R., Kahan, B., Sollinger, H., Li, Y., Cretin, N., and Tedesco, H. (2005) Transplantation 80 244–252 - PubMed
-
- Thomas, G., Sabatini, D., and Hall, M. N. (eds) (2004) Current Topics in Microbiology and Immunology: Target of Rapamycin, Springer, New York
Publication types
MeSH terms
Substances
Grants and funding
LinkOut - more resources
Full Text Sources
Molecular Biology Databases
