

doi: 10.1093/bioinformatics/btn021.
Epub 2008 Feb 1.
Using flowViz to visualize flow cytometry data
Affiliations
- PMID: 18245128
- PMCID: PMC2768483
- DOI: 10.1093/bioinformatics/btn021
Item in Clipboard
Using flowViz to visualize flow cytometry data
Bioinformatics.
.
Abstract
Automated analysis of flow cytometry (FCM) data is essential for it to become successful as a high throughput technology. We believe that the principles of Trellis graphics can be adapted to provide useful visualizations that can aid such automation. In this article, we describe the R/Bioconductor package flowViz that implements such visualizations.
Availability: flowViz is available as an R package from the Bioconductor project: http://bioconductor.org
Figures
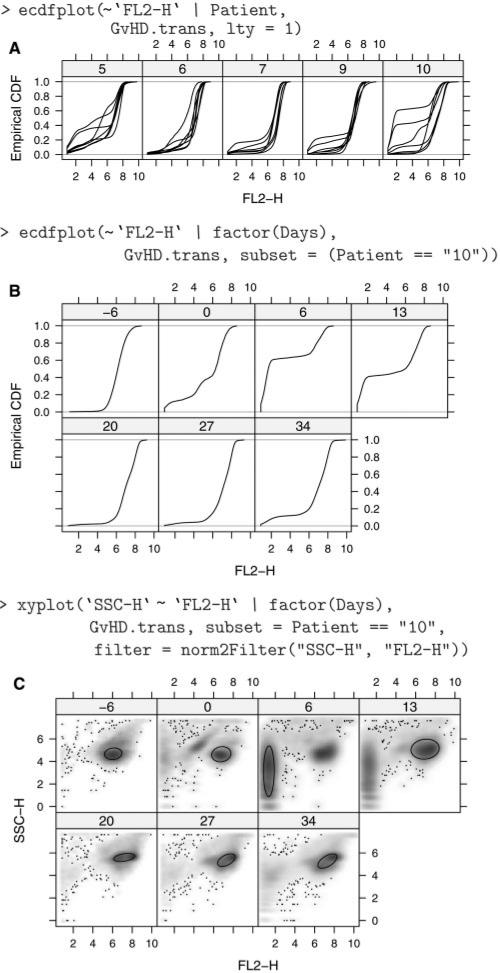
(A) ECDF plots of FL2-H for five patients; each line represents a different visit. Patient 10 has two samples (visits) that look different from the others. (B) ECDF plots of FL2-H restricted to Patient 10. We can now see that the samples taken 6 and 13 days after transplant were the unusual ones. (C) Smoothed scatter plots of SSC-H and FL2-H for patient 10. The result of a data-driven filter is superposed, and we can see that a different population has been identified for the sample taken at day 6.
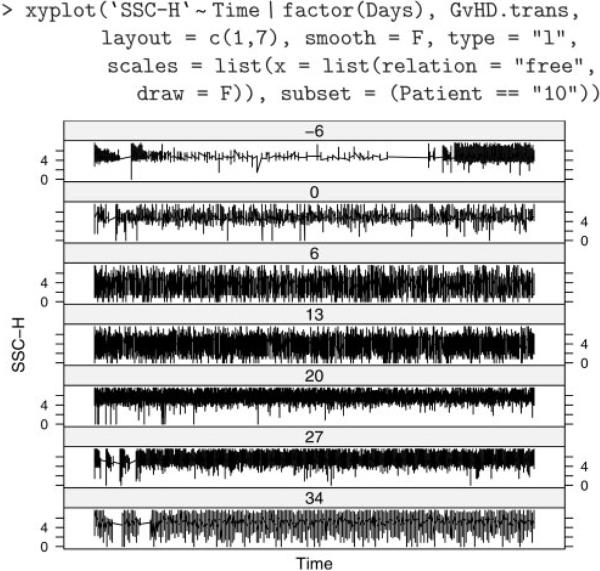
Side scatter values over time (scaled separately for each sample) for patient 10. The first sample (labeled –6) possibly had problems (e.g., bubbles, clogs, etc.) in the initial period of collection.
References
-
- Becker RA, et al. The visual design and control of trellis display. JCGS. 1996;5:123–155.
-
- Cleveland WS. Visualizing Data. Hobart Press; Summit, New Jersey: 1993.
Publication types
MeSH terms
Grants and funding
LinkOut - more resources
Full Text Sources
Molecular Biology Databases
