

Abundances and distributions of the dominant nifH phylotypes in the Northern Atlantic Ocean
- PMID: 18245263
- PMCID: PMC2268318
- DOI: 10.1128/AEM.01720-07
Abundances and distributions of the dominant nifH phylotypes in the Northern Atlantic Ocean
Abstract
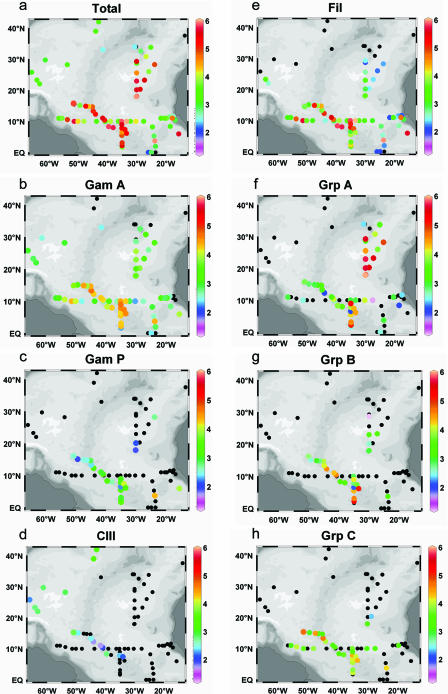
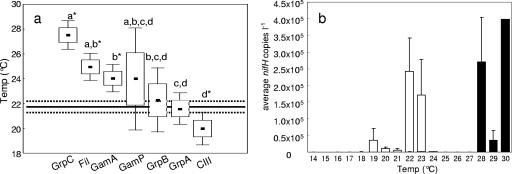
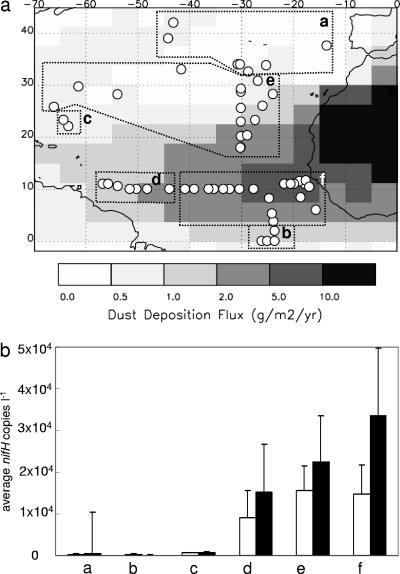
Understanding the factors that influence the distribution and abundance of marine diazotrophs is important in order to assess their role in the oceanic nitrogen cycle. Environmental DNA samples from four cruises to the North Atlantic Ocean, covering a sampling area of 0 degrees N to 42 degrees N and 67 degrees W to 13 degrees W, were analyzed for the presence and amount of seven nifH phylotypes using real-time quantitative PCR and TaqMan probes. The cyanobacterial phylotypes dominated in abundance (94% of all nifH copies detected) and were the most widely distributed. The filamentous cyanobacterial type, which included both Trichodesmium and Katagnymene, was the most abundant (51%), followed by group A, an uncultured unicellular cyanobacterium (33%), and gamma A, an uncultured gammaproteobacterium (6%). Group B, unicellular cyanobacterium Crocosphaera, and group C Cyanothece-like phylotypes were not often detected (6.9% and 2.3%, respectively), but where present, could reach high concentrations. Gamma P, another uncultured gammaproteobacterium, was seldom detected (0.5%). Water temperature appeared to influence the distribution of many nifH phylotypes. Very high (up to 1 x 10(6) copies liter(-1)) nifH concentrations of group A were detected in the eastern basin (25 to 17 degrees N, 27 to 30 degrees W), where the temperature ranged from 20 to 23 degrees C. The highest concentrations of filamentous phylotypes were measured between 25 and 30 degrees C. The uncultured cluster III phylotype was uncommon (0.4%) and was associated with mean water temperatures of 18 degrees C. Diazotroph abundance was highest in regions where modeled average dust deposition was between 1 and 2 g/m(2)/year.
Figures
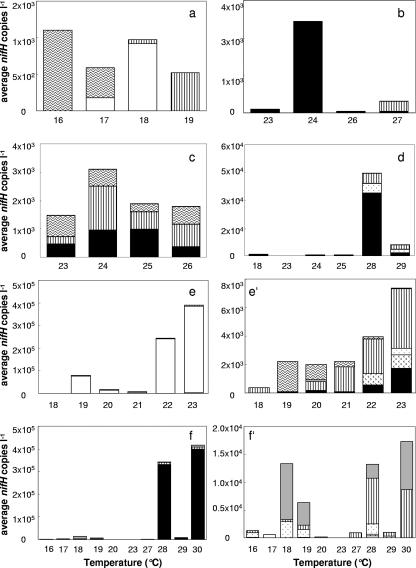
 , group B;
  , group C; ▥, gamma A;
  , gamma P; and
  , cluster III. The numbers of samples for regions a, b, c, d, e, and f are 21, 8, 6, 40, 105, and 96, respectively. Panels e′ and f′ show the average numbers of nifH copies liter−1 from panels e and f without the dominant group A and filamentous phylotypes, respectively.
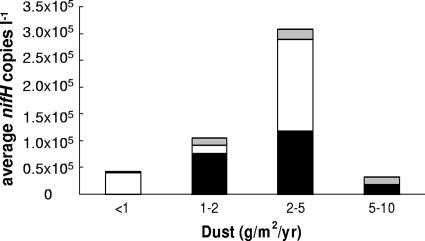
References
-
- Atallah, Z. K., J. Bae, S. H. Jansky, D. I. Rouse, and W. R. Stevenson. 2007. Multiplex real-time quantitative PCR to detect and quantify Verticillium dahliae colonization in potato lines that differ in response to verticillium wilt. Am. Phytopathol. Soc. 97:865-872. - PubMed
-
- Baker, A. R., and T. D. Jickells. 2006. Mineral particle size as a control on aerosol iron solubility. Geophys. Res. Lett. 33:.
-
- Berman-Frank, I., P. Lundgren, and P. Falkowski. 2003. Nitrogen fixation and photosynthetic oxygen evolution in cyanobacteria. Res. Microbiol. 154:157-164. - PubMed
-
- Breitbarth, E., A. Oschlies, and J. La Roche. 2006. Physiological constraints on the global distribution of Trichodesmium—effect of temperature on diazotrophy. Biogeosciences. www.biogeosciences.net/3/1/2006.
Publication types
MeSH terms
Substances
LinkOut - more resources
Full Text Sources
Other Literature Sources
