. 2008 Apr;178(4):2031-43.
doi: 10.1534/genetics.107.083279. Epub 2008 Feb 1.

Low levels of polymorphism in genes that control the activation of defense response in Arabidopsis thaliana

Affiliations

Low levels of polymorphism in genes that control the activation of defense response in Arabidopsis thaliana

Erica G Bakker et al. Genetics. 2008 Apr.

Abstract

Plants use signaling pathways involving salicylic acid, jasmonic acid, and ethylene to defend against pathogen and herbivore attack. Many defense response genes involved in these signaling pathways have been characterized, but little is known about the selective pressures they experience. A representative set of 27 defense response genes were resequenced in a worldwide set of 96 Arabidopsis thaliana accessions, and patterns of single nucleotide polymorphisms (SNPs) were evaluated in relation to an empirical distribution of SNPs generated from either 876 fragments or 236 fragments with >400 bp coding sequence (this latter set was selected for comparisons with coding sequences) distributed across the genomes of the same set of accessions. Defense response genes have significantly fewer protein variants, display lower levels of nonsynonymous nucleotide diversity, and have fewer nonsynonymous segregating sites. The majority of defense response genes appear to be experiencing purifying selection, given the dearth of protein variation in this set of genes. Eight genes exhibit some evidence of partial selective sweeps or transient balancing selection. These results therefore provide a strong contrast to the high levels of balancing selection exhibited by genes at the upstream positions in these signaling pathways.


Figures
F<sc>igure</sc> 1.—
Figure 1.—
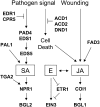
A model showing putative positions of 17 defense genes in the salicylate (SA)-, jasmonate (JA)-, and ethylene (E)-dependent signaling pathways in A. thaliana. PAD4, EDS1, EDS5, NPR1, BGL2, EDR1, CPR5, ACD1, ACD2, DND1, and COI1 are shown as in Glazebrook (2001) and Glazebrook et al. (2003). PAL1 (Mauch-Mani and Slusarenko 1996) and FAD3 (McConn and Browse 1996) are involved in the synthesis of salicylic acid and jasmonic acid, respectively. ETR1 is a histidine kinase that binds ethylene (Guo and Ecker 2004) and negatively regulates the EIN3 transcription factor (Gagne et al. 2004). AHBP1 is a transcription factor that interacts with NPR1 (Fan and Dong 2002; Pieterse and Van Loon 2004). BGL1 is a beta-glucosidase enzyme upregulated by jasmonic acid, but not by salicylic acid (Stotz et al. 2000). The following 10 defense genes do not currently fit clearly in the model: NPR2 and NPR3 are ankyrin repeat proteins similar to NPR1 in predicted function (Liu et al. 2005). NHL1 and NHL3 are plasma membrane proteins with probable roles in the hypersensitive response (Varet et al. 2003; Zheng et al. 2004). PBS2 (Holt et al. 2005) and PBS1 (Shao et al. 2003) interact directly with specific R genes. PAD3 is a cytochrome P450 required for camalexin synthesis (Zhou et al. 1999). ATR1 and ESP are enzymes involved in glucosinolate synthesis (Naur et al. 2003) and hydrolysis (Lambrix et al. 2001), respectively. GL1 is a transcription factor required for trichome initiation (Oppenheimer et al. 1991).
F<sc>igure</sc> 2.—
Figure 2.—
Neighbor-joining trees based on silent sites (Nei and Gojobori 1986), sorted on the basis of the level of allelic divergence. 1, at1g52400 (BGL1); 2, at5g13160 (PBS1); 3, at3g52430 (PAD4); 4, at3g57260 (BGL2); 5, at3g20770 (EIN3); 6, at2g39940 (COI1); 7, at5g51700 (PBS2); 8, at5g06950 (AHBP1); 9, at4g31500 (CYP83B1); 10, at4g39030 (EDS5); 11, at5g64930 (CPR5); 12, at3g11660 (NHL1); 13, at1g54040 (ESP); 14, at3g26830 (PAD3); 15, at3g48090 (EDS1); 16, at2g29980 (FAD3); 17, at5g06320 (NHL3); 18, at1g08720 (EDR1); 19, at5g45110 (NPR3); 20, at3g44880 (ACD1); 21, at4g37000 (ACD2); 22, at4g26120 (NPR2); 23, at3g27920 (GL1); 24, at1g64280 (NPR1); 25, at2g37040 (PAL1); 26, at5g15410 (DND1); and 27, at1g66290 (ETR1). Scale bar reflects 0.01 substitutions per site.
F<sc>igure</sc> 3.—
Figure 3.—
Allele frequency distribution for synonymous and nonsynonymous SNPs observed for the set of 27 defense response genes and the set of 876 random genomic fragments.
F<sc>igure</sc> 4.—
Figure 4.—
Principal component analysis for 27 defense response genes based on the correlation matrix of seven summary statistics (Ksmax, π, S, Tajima's D, Rh, Fst, number of protein variants). Candidates for balancing selection and selective sweep are marked with triangles and squares, respectively, whereas genes with intermediate characteristics are marked with solid circles.
F<sc>igure</sc> 5.—
Figure 5.—
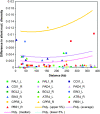
Difference in silent nucleotide diversity between eight defense response genes and their flanking fragments located at increasing physical distances. Fragments that are located to the left and right side of each defense response gene are indicated with squares and triangles, respectively. Upper and lower 5% tails, median and average values are indicated by polynomial trendlines calculated for 50-kb sliding windows with a 1-kb increment for silent nucleotide differences between the set of 876 random genomic fragments and their nearest neighbors.
F<sc>igure</sc> 6.—
Figure 6.—
Haplotype sharing for 12,038 alleles from a set of 1204 random fragments and 252 alleles from a set of 27 defense response genes is depicted by gray and black circles, respectively. The 95th percentile of the reference data distribution is represented by a black line. Alleles from the 5 defense response genes that contain an allele in the top 5% of the distribution are color coded.

References

    1. Aarts, N., M. Metz, E. Holub, B. J. Staskawicz, M. J. Daniels et al., 1998. Different requirements for EDS1 and NDR1 by disease resistance genes define at least two R gene-mediated signaling pathways in Arabidopsis. Proc. Natl. Acad. Sci. USA 95 10306–10311. - PMC - PubMed
    1. Aguadé, M., 2001. Nucleotide sequence variation at two genes of the phenylpropanoid pathway, the FAH1 and F3H genes, in Arabidopsis thaliana. Mol. Biol. Evol. 18 1–9. - PubMed
    1. Aguadé, M., N. Miyashita and C. F. Langley, 1989. Reduced variation in the yellow-achaete-scute region in natural populations of Drosophila melanogaster. Genetics 122 607–615. - PMC - PubMed
    1. Akey, J. M., G. Zhang, K. Zhang, L. Jin and M. D. Shriver, 2002. Interrogating a high-density SNP map for signatures of natural selection. Genome Res. 12 1805–1814. - PMC - PubMed
    1. Akey, J. M., M. A. Eberle, M. J. Rieder, C. S. Carlson, M. D. Shriver et al., 2004. Population history and natural selection shape patterns of genetic variation in 132 genes. PLoS Biol. 2(10): e286. - PMC - PubMed

Publication types