. 2008 Feb 12;105(6):2140-5.
doi: 10.1073/pnas.0711573105. Epub 2008 Feb 1.

Kinetic analysis of a complete poxvirus transcriptome reveals an immediate-early class of genes

Affiliations

Kinetic analysis of a complete poxvirus transcriptome reveals an immediate-early class of genes

Erika Assarsson et al. Proc Natl Acad Sci U S A. .

Erratum in

  • Proc Natl Acad Sci U S A. 2008 May 6;105(18):6787

Abstract

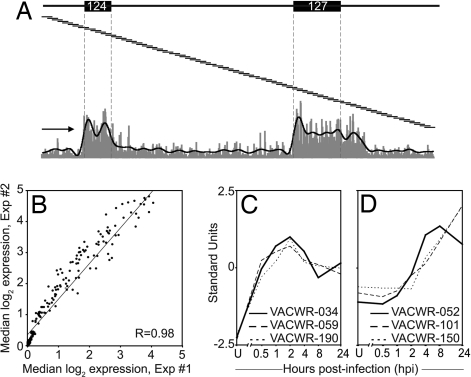
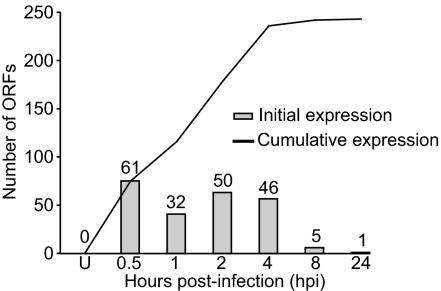
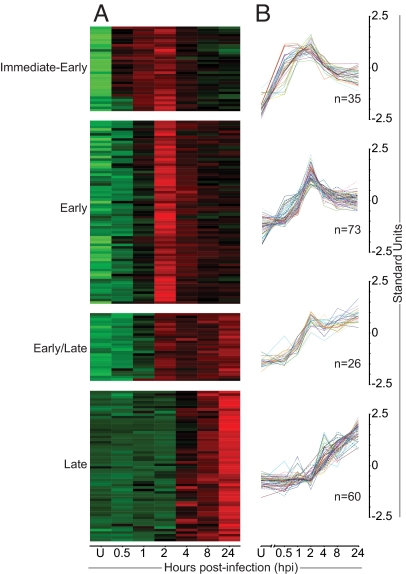
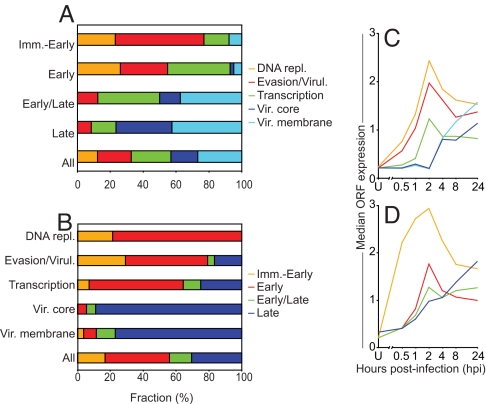
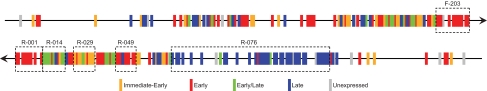
Vaccinia virus is the prototypic orthopoxvirus and was the vaccine used to eradicate smallpox, yet the expression profiles of many of its genes remain unknown. Using a genome tiling array approach, we simultaneously measured the expression levels of all 223 annotated vaccinia virus genes during infection and determined their kinetics. For 95% of these genes, significant transcript levels were detected. Most remarkably, classification of the genes by their expression profiles revealed 35 genes exhibiting immediate-early expression. Although a similar kinetic class has been described for other virus families, to our knowledge, this is the first demonstration of its existence in orthopoxviruses. Despite expression levels higher than for genes in the other three kinetic classes, the functions of more than half of these remain unknown. Additionally, genes within each kinetic class were spatially grouped together in the genome. This genome-wide picture of transcription alters our understanding of how orthopoxviruses regulate gene expression.


Conflict of interest statement

The authors declare no conflict of interest.

Figures

Fig. 1.
Fig. 1.
Validation of the genome tiling array technology. (A) Shown is an overview of the genome tiling array technique including probe signal intensity of a sample from 2 hpi, covering ≈7 kb of the forward strand. ORFs VACWR-124 and VACWR-127 are indicated. The 25-mer probes (not to scale) spanning this region are represented as overlapping lines. A fluorescence signal is obtained from each individual probe (vertical gray bars at the bottom) and all probes lying completely within an ORF (bounded by vertical dashed lines) are pooled. The black line is a result of smoothing the signal over 25 probes. The arrow indicates transcriptional orientation. (B) RNA was prepared in two different experiments at 2 hpi, and median probe signal intensities for each gene were compared. (C) Shown are relative expression levels (standard units) for a set of known early or (D) late genes over time course.
Fig. 2.
Fig. 2.
The vast majority of annotated ORFs for VACV are expressed during infection. Shown are the number of ORFs whose transcription is initiated (bars) in uninfected cells (U) and at 0.5–24 hpi and the cumulative number of genes whose expression was detected by each time point (line).
Fig. 3.
Fig. 3.
Cluster analysis of expression profiles revealed an immediate-early class of genes. Genes were divided into four groups based on hierarchical clustering of kinetic expression data. (A) A heat-map representation of ORF expression is shown. Colors indicate the probe intensity level for each gene in uninfected cells (U) and at 0.5–24 hpi; green and red represent lower and higher expression, respectively. (B) Relative expression levels are shown throughout the same time course as in A.
Fig. 4.
Fig. 4.
Function and expression levels of genes in the different classes. (A) Shown are the four gene classes with the fraction (%) of each class having a certain function indicated. (B) Shown are groups of genes associated with a specific function, with the fraction (%) of each group belonging to each kinetic class indicated. (C and D) Shown is median ORF expression at each time point for genes within each functional category (C) and kinetic class (D).
Fig. 5.
Fig. 5.
Genes of different kinetic classes are clustered in the genome. Temporal expression is shown for each gene along the two strands of the VACV genome. The genes are positioned in their proper order, but sizes and spacing have been drawn identical for all ORFs. Boxes denote regions with an overrepresentation of genes from a certain kinetic class. F/R indicates the strand and numbers represent the VACWR name of the first ORF in each region.

Comment in

  • Poxvirus transcriptome analysis.
    Satheshkumar PS, Moss B. Satheshkumar PS, et al. Proc Natl Acad Sci U S A. 2008 Oct 7;105(40):E62; author reply E63-4. doi: 10.1073/pnas.0804594105. Epub 2008 Oct 1. Proc Natl Acad Sci U S A. 2008. PMID: 18832142 Free PMC article. No abstract available.

Similar articles

Cited by

References

    1. Becker Y, Joklik WK. Messenger RNA in cells infected with vaccinia virus. Proc Natl Acad Sci USA. 1964;51:577–585. - PMC - PubMed
    1. Pedle S, Cooper RJ. The inhibition of HELA cell RNA synthesis following infection with vaccinia virus. J Gen Virol. 1984;65:1687–1697. - PubMed
    1. Bablanian R, Coppola G, Scribani S, Esteban M. Inhibition of protein synthesis by vaccinia virus. IV. The role of low-molecular-weight viral RNA in the inhibition of protein synthesis. Virology. 1981;112:13–24. - PubMed
    1. Bablanian R, Baxt B, Sonnabend JA, Esteban M. Studies on the mechanisms of vaccinia virus cytopathic effects. II. Early cell rounding is associated with virus polypeptide synthesis. J Gen Virol. 1978;39:403–413. - PubMed
    1. Broyles SS. Vaccinia virus transcription. J Gen Virol. 2003;84:2293–2303. - PubMed

Publication types