

A first-generation multiplex biomarker analysis of urine for the early detection of prostate cancer
- PMID: 18245462
- PMCID: PMC2998181
- DOI: 10.1158/0008-5472.CAN-07-3224
A first-generation multiplex biomarker analysis of urine for the early detection of prostate cancer
Abstract
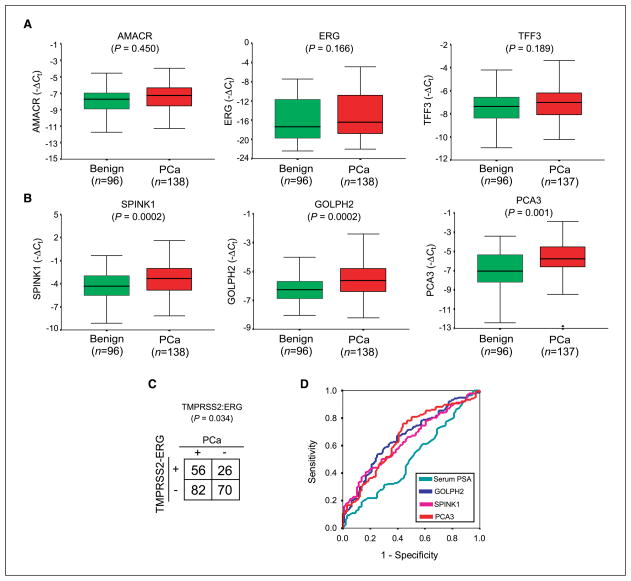
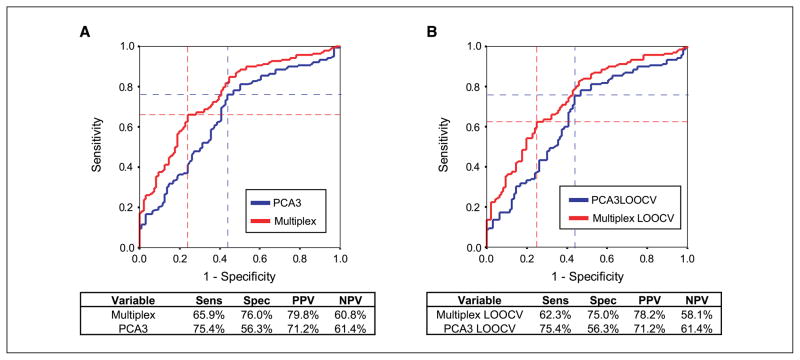
Although prostate-specific antigen (PSA) serum level is currently the standard of care for prostate cancer screening in the United States, it lacks ideal specificity and additional biomarkers are needed to supplement or potentially replace serum PSA testing. Emerging evidence suggests that monitoring the noncoding RNA transcript PCA3 in urine may be useful in detecting prostate cancer in patients with elevated PSA levels. Here, we show that a multiplex panel of urine transcripts outperforms PCA3 transcript alone for the detection of prostate cancer. We measured the expression of seven putative prostate cancer biomarkers, including PCA3, in sedimented urine using quantitative PCR on a cohort of 234 patients presenting for biopsy or radical prostatectomy. By univariate analysis, we found that increased GOLPH2, SPINK1, and PCA3 transcript expression and TMPRSS2:ERG fusion status were significant predictors of prostate cancer. Multivariate regression analysis showed that a multiplexed model, including these biomarkers, outperformed serum PSA or PCA3 alone in detecting prostate cancer. The area under the receiver-operating characteristic curve was 0.758 for the multiplexed model versus 0.662 for PCA3 alone (P = 0.003). The sensitivity and specificity for the multiplexed model were 65.9% and 76.0%, respectively, and the positive and negative predictive values were 79.8% and 60.8%, respectively. Taken together, these results provide the framework for the development of highly optimized, multiplex urine biomarker tests for more accurate detection of prostate cancer.
Figures
Similar articles
-
Study of genetic and epigenetic alterations in urine samples as diagnostic markers for prostate cancer.Anticancer Res. 2013 Jan;33(1):191-7. Anticancer Res. 2013. PMID: 23267145
-
Combining urinary detection of TMPRSS2:ERG and PCA3 with serum PSA to predict diagnosis of prostate cancer.Urol Oncol. 2013 Jul;31(5):566-71. doi: 10.1016/j.urolonc.2011.04.001. Epub 2011 May 19. Urol Oncol. 2013. PMID: 21600800 Free PMC article.
-
Urine TMPRSS2:ERG Plus PCA3 for Individualized Prostate Cancer Risk Assessment.Eur Urol. 2016 Jul;70(1):45-53. doi: 10.1016/j.eururo.2015.04.039. Epub 2015 May 16. Eur Urol. 2016. PMID: 25985884 Free PMC article.
-
Urinary biomarkers for prostate cancer: a review.Asian J Androl. 2013 May;15(3):333-9. doi: 10.1038/aja.2013.6. Epub 2013 Mar 25. Asian J Androl. 2013. PMID: 23524531 Free PMC article. Review.
-
Urine TMPRSS2: ERG Fusion Transcript as a Biomarker for Prostate Cancer: Literature Review.Clin Genitourin Cancer. 2016 Apr;14(2):117-21. doi: 10.1016/j.clgc.2015.12.001. Epub 2015 Dec 17. Clin Genitourin Cancer. 2016. PMID: 26774207 Review.
Cited by
-
PCA3 and TMPRSS2-ERG: Promising Biomarkers in Prostate Cancer Diagnosis.Cancers (Basel). 2010 Jul 6;2(3):1432-40. doi: 10.3390/cancers2031432. Cancers (Basel). 2010. PMID: 24281166 Free PMC article.
-
The use of PCA3 in the diagnosis of prostate cancer.Nat Rev Urol. 2009 May;6(5):255-61. doi: 10.1038/nrurol.2009.40. Nat Rev Urol. 2009. PMID: 19424173 Review.
-
Assessment of long-term outcomes associated with urinary prostate cancer antigen 3 and TMPRSS2:ERG gene fusion at repeat biopsy.Cancer. 2015 Nov 15;121(22):4071-9. doi: 10.1002/cncr.29611. Epub 2015 Aug 17. Cancer. 2015. PMID: 26280815 Free PMC article.
-
Prostate cancer markers: An update.Biomed Rep. 2016 Mar;4(3):263-268. doi: 10.3892/br.2016.586. Epub 2016 Jan 29. Biomed Rep. 2016. PMID: 26998261 Free PMC article.
-
Quantitative Lateral Flow Assays for Salivary Biomarker Assessment: A Review.Front Public Health. 2017 Jun 14;5:133. doi: 10.3389/fpubh.2017.00133. eCollection 2017. Front Public Health. 2017. PMID: 28660183 Free PMC article. Review.
References
-
- Brawer MK, Chetner MP, Beatie J, Buchner DM, Vessella RL, Lange PH. Screening for prostatic carcinoma with prostate specific antigen. J Urol. 1992;147:841–5. - PubMed
-
- Catalona WJ, Smith DS, Ratliff TL, et al. Measurement of prostate-specific antigen in serum as a screening test for prostate cancer. N Engl J Med. 1991;324:1156–61. - PubMed
-
- Brawley OW, Knopf K, Merrill R. The epidemiology of prostate cancer part I: descriptive epidemiology. Semin Urol Oncol. 1998;16:187–92. - PubMed
-
- Catalona WJ, Hudson MA, Scardino PT, et al. Selection of optimal prostate specific antigen cutoffs for early detection of prostate cancer: receiver operating characteristic curves. J Urol. 1994;152:2037–42. - PubMed
-
- Thompson IM, Pauler DK, Goodman PJ, et al. Prevalence of prostate cancer among men with a prostate-specific antigen level ≤4.0 ng per milliliter. N Engl J Med. 2004;350:2239–46. - PubMed
Publication types
MeSH terms
Substances
Grants and funding
LinkOut - more resources
Full Text Sources
Other Literature Sources
Medical
Research Materials
Miscellaneous
