. 2008 Feb 1;68(3):664-73.
doi: 10.1158/0008-5472.CAN-07-2615.

Modeling genomic diversity and tumor dependency in malignant melanoma

Affiliations

Modeling genomic diversity and tumor dependency in malignant melanoma

William M Lin et al. Cancer Res. .

Abstract

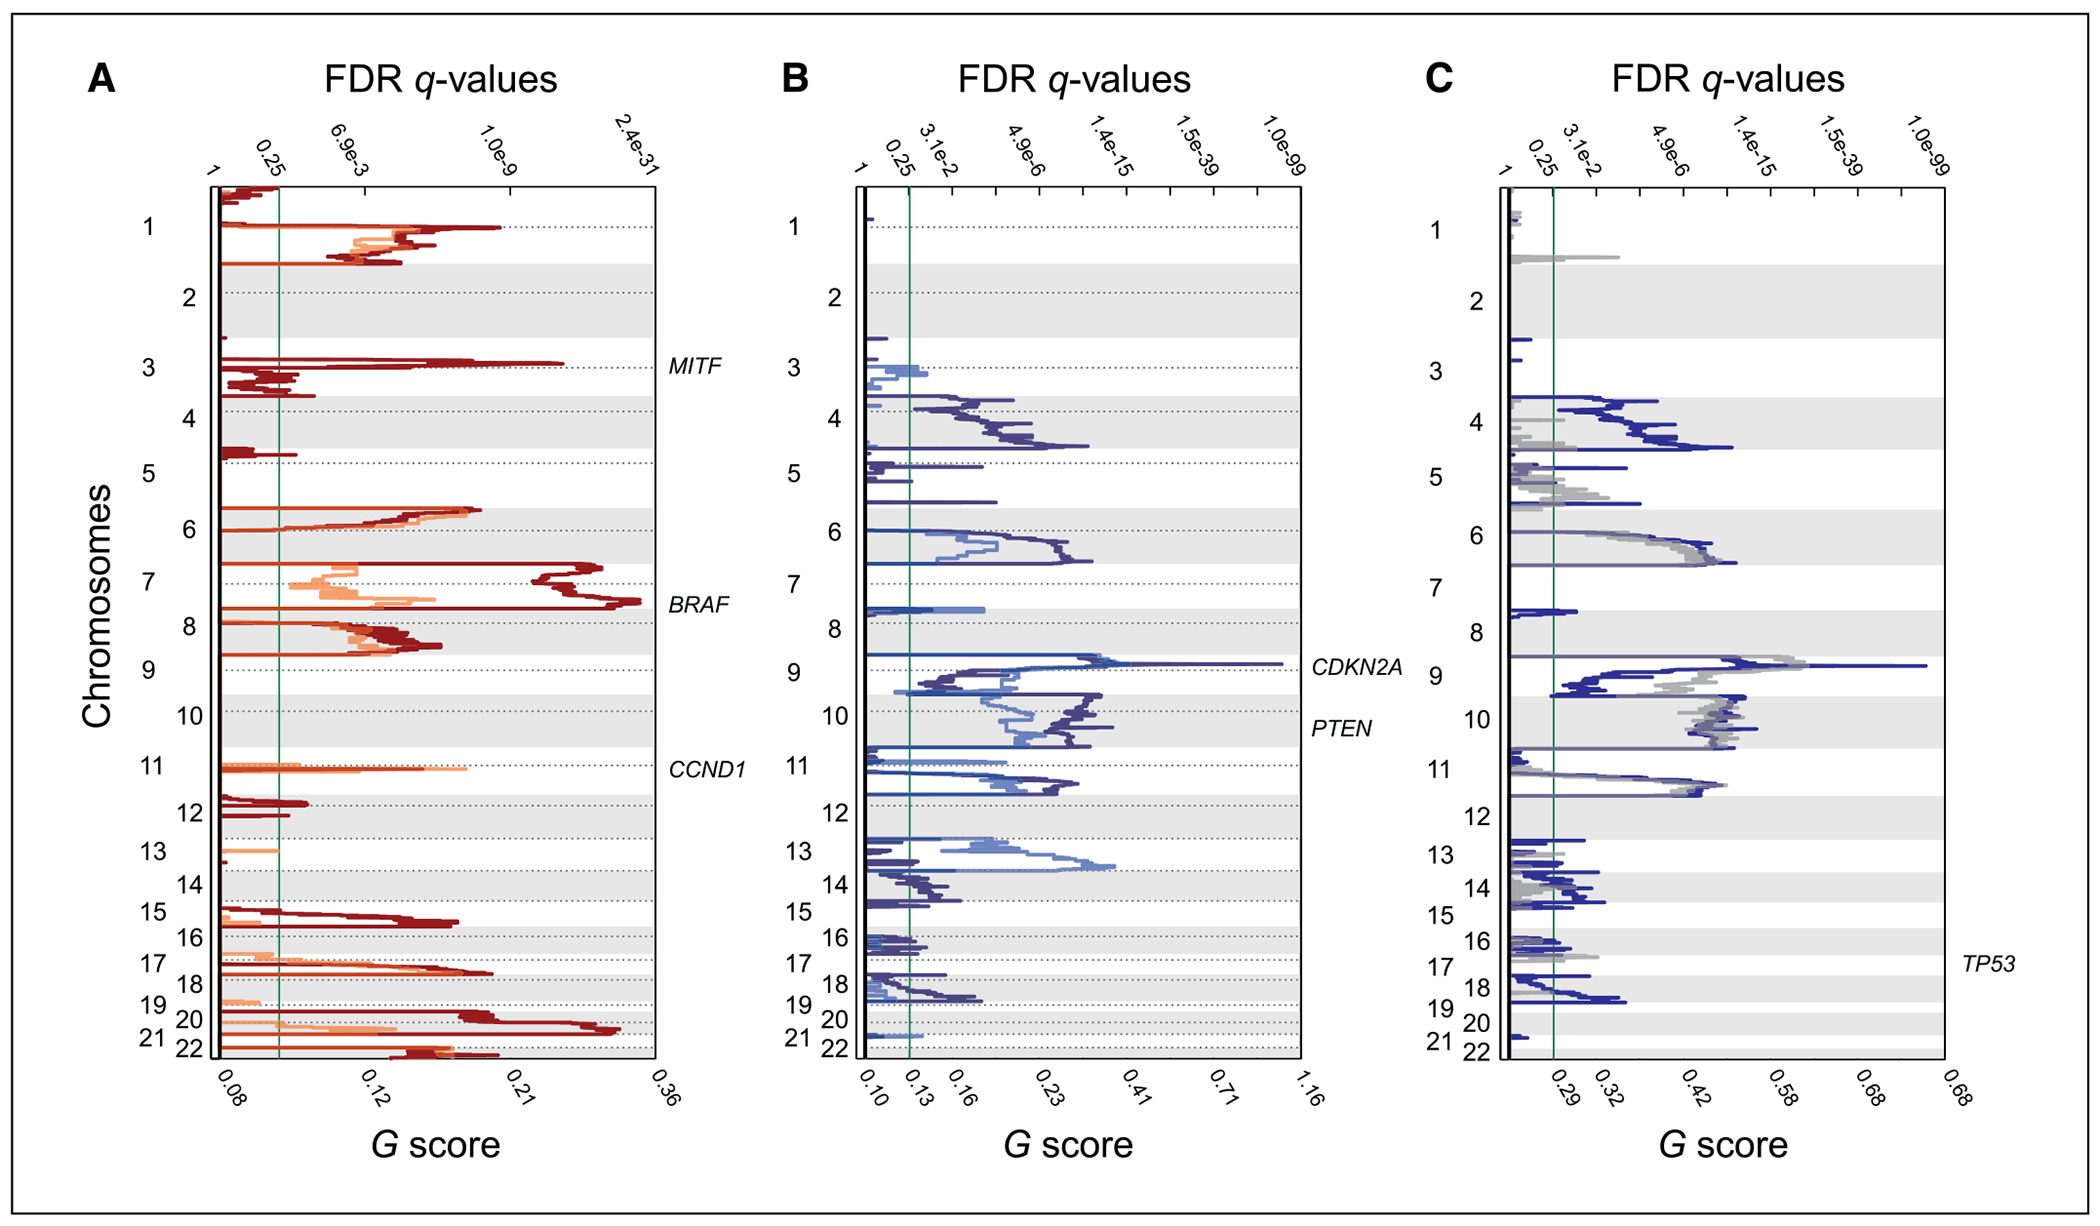
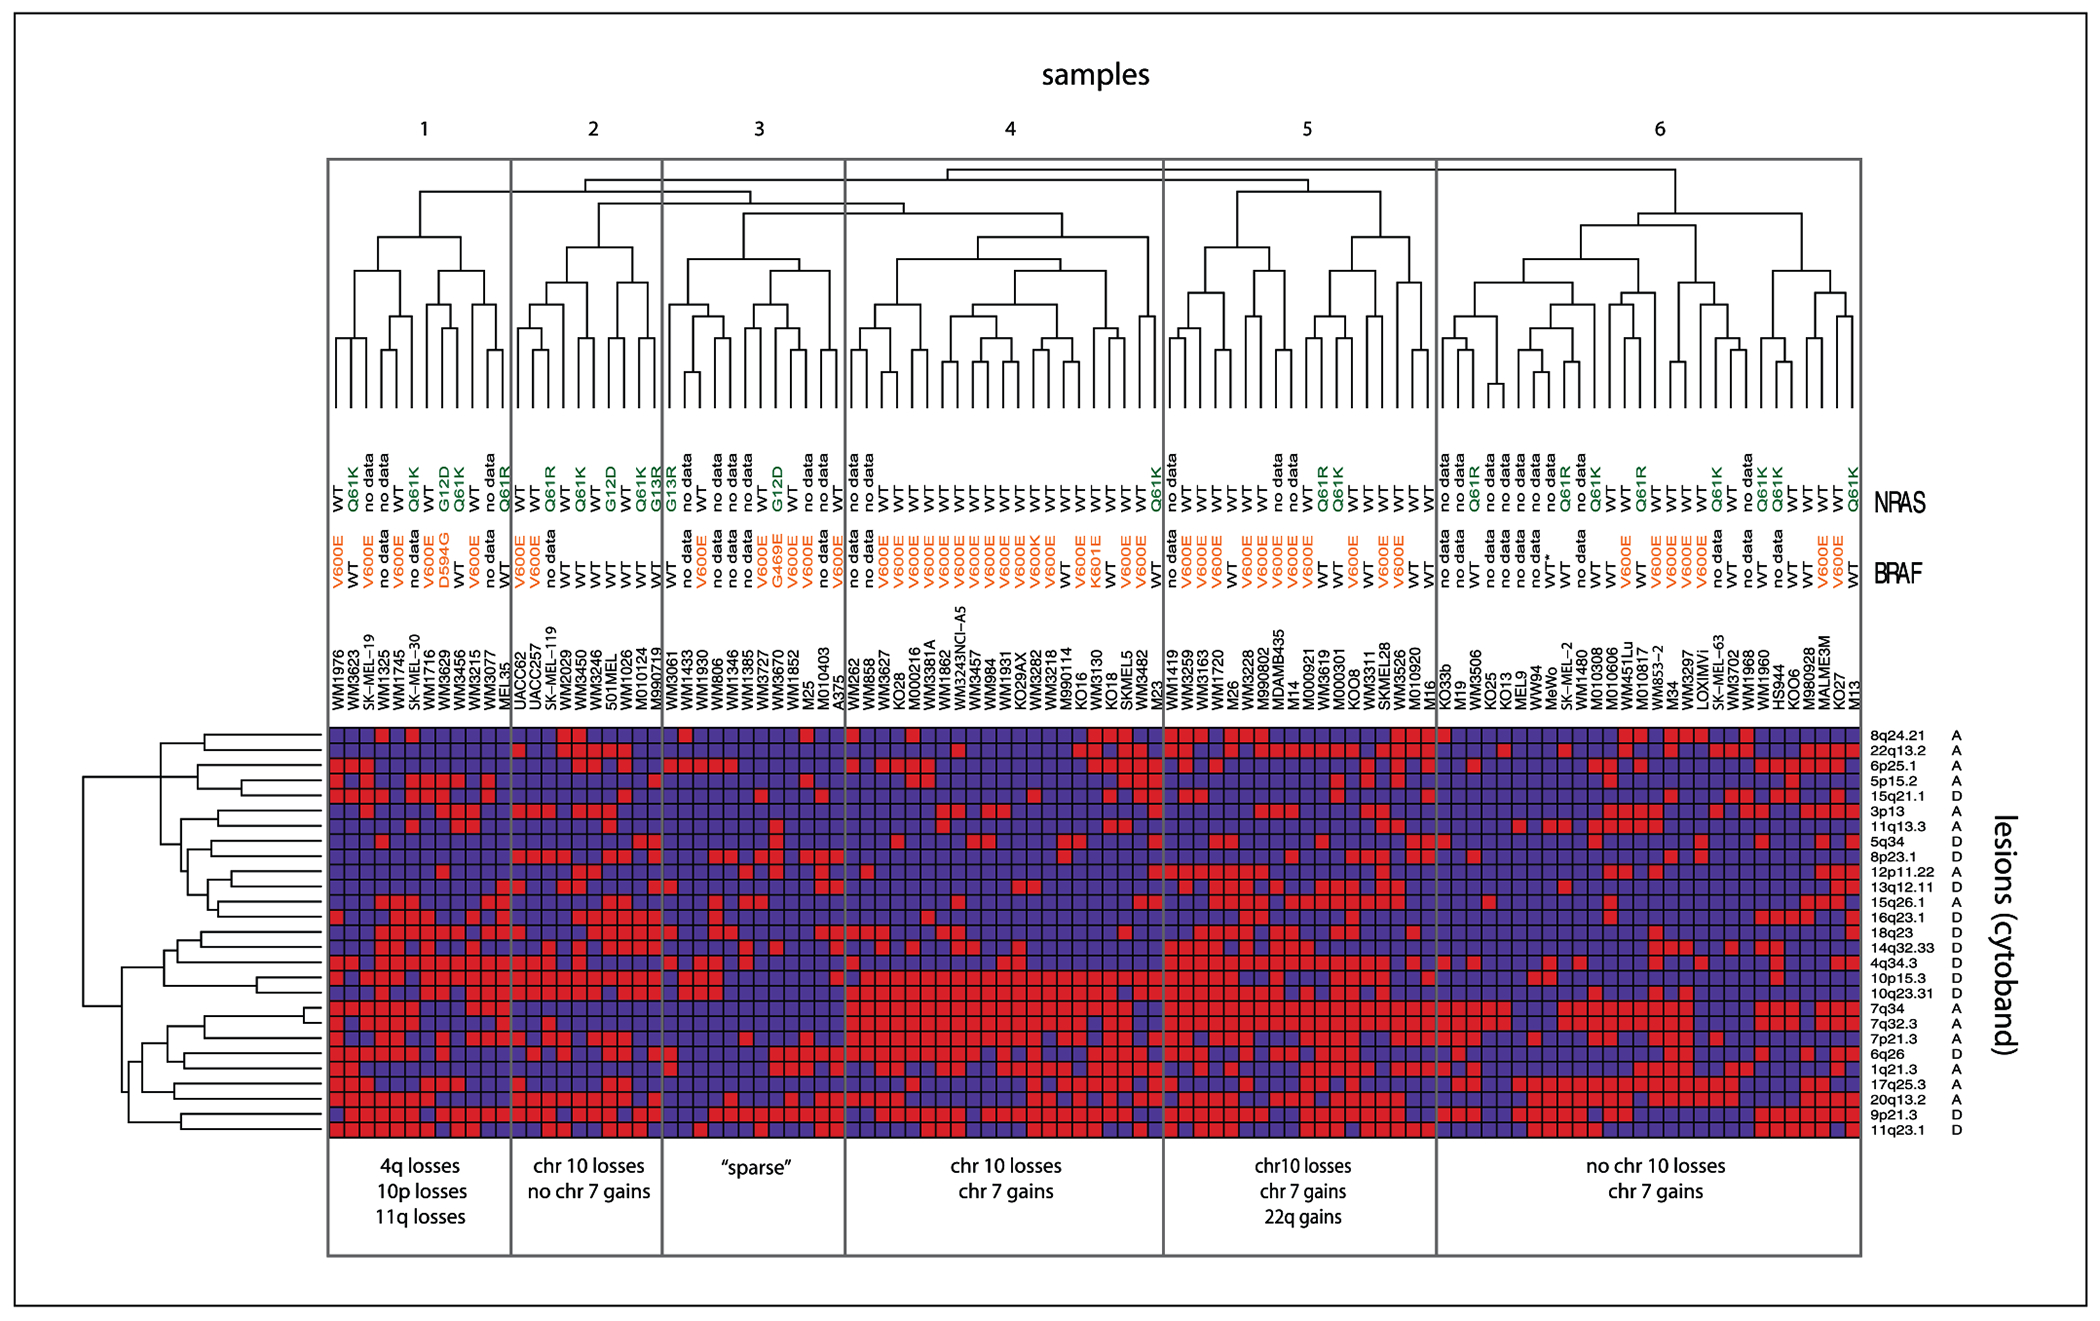
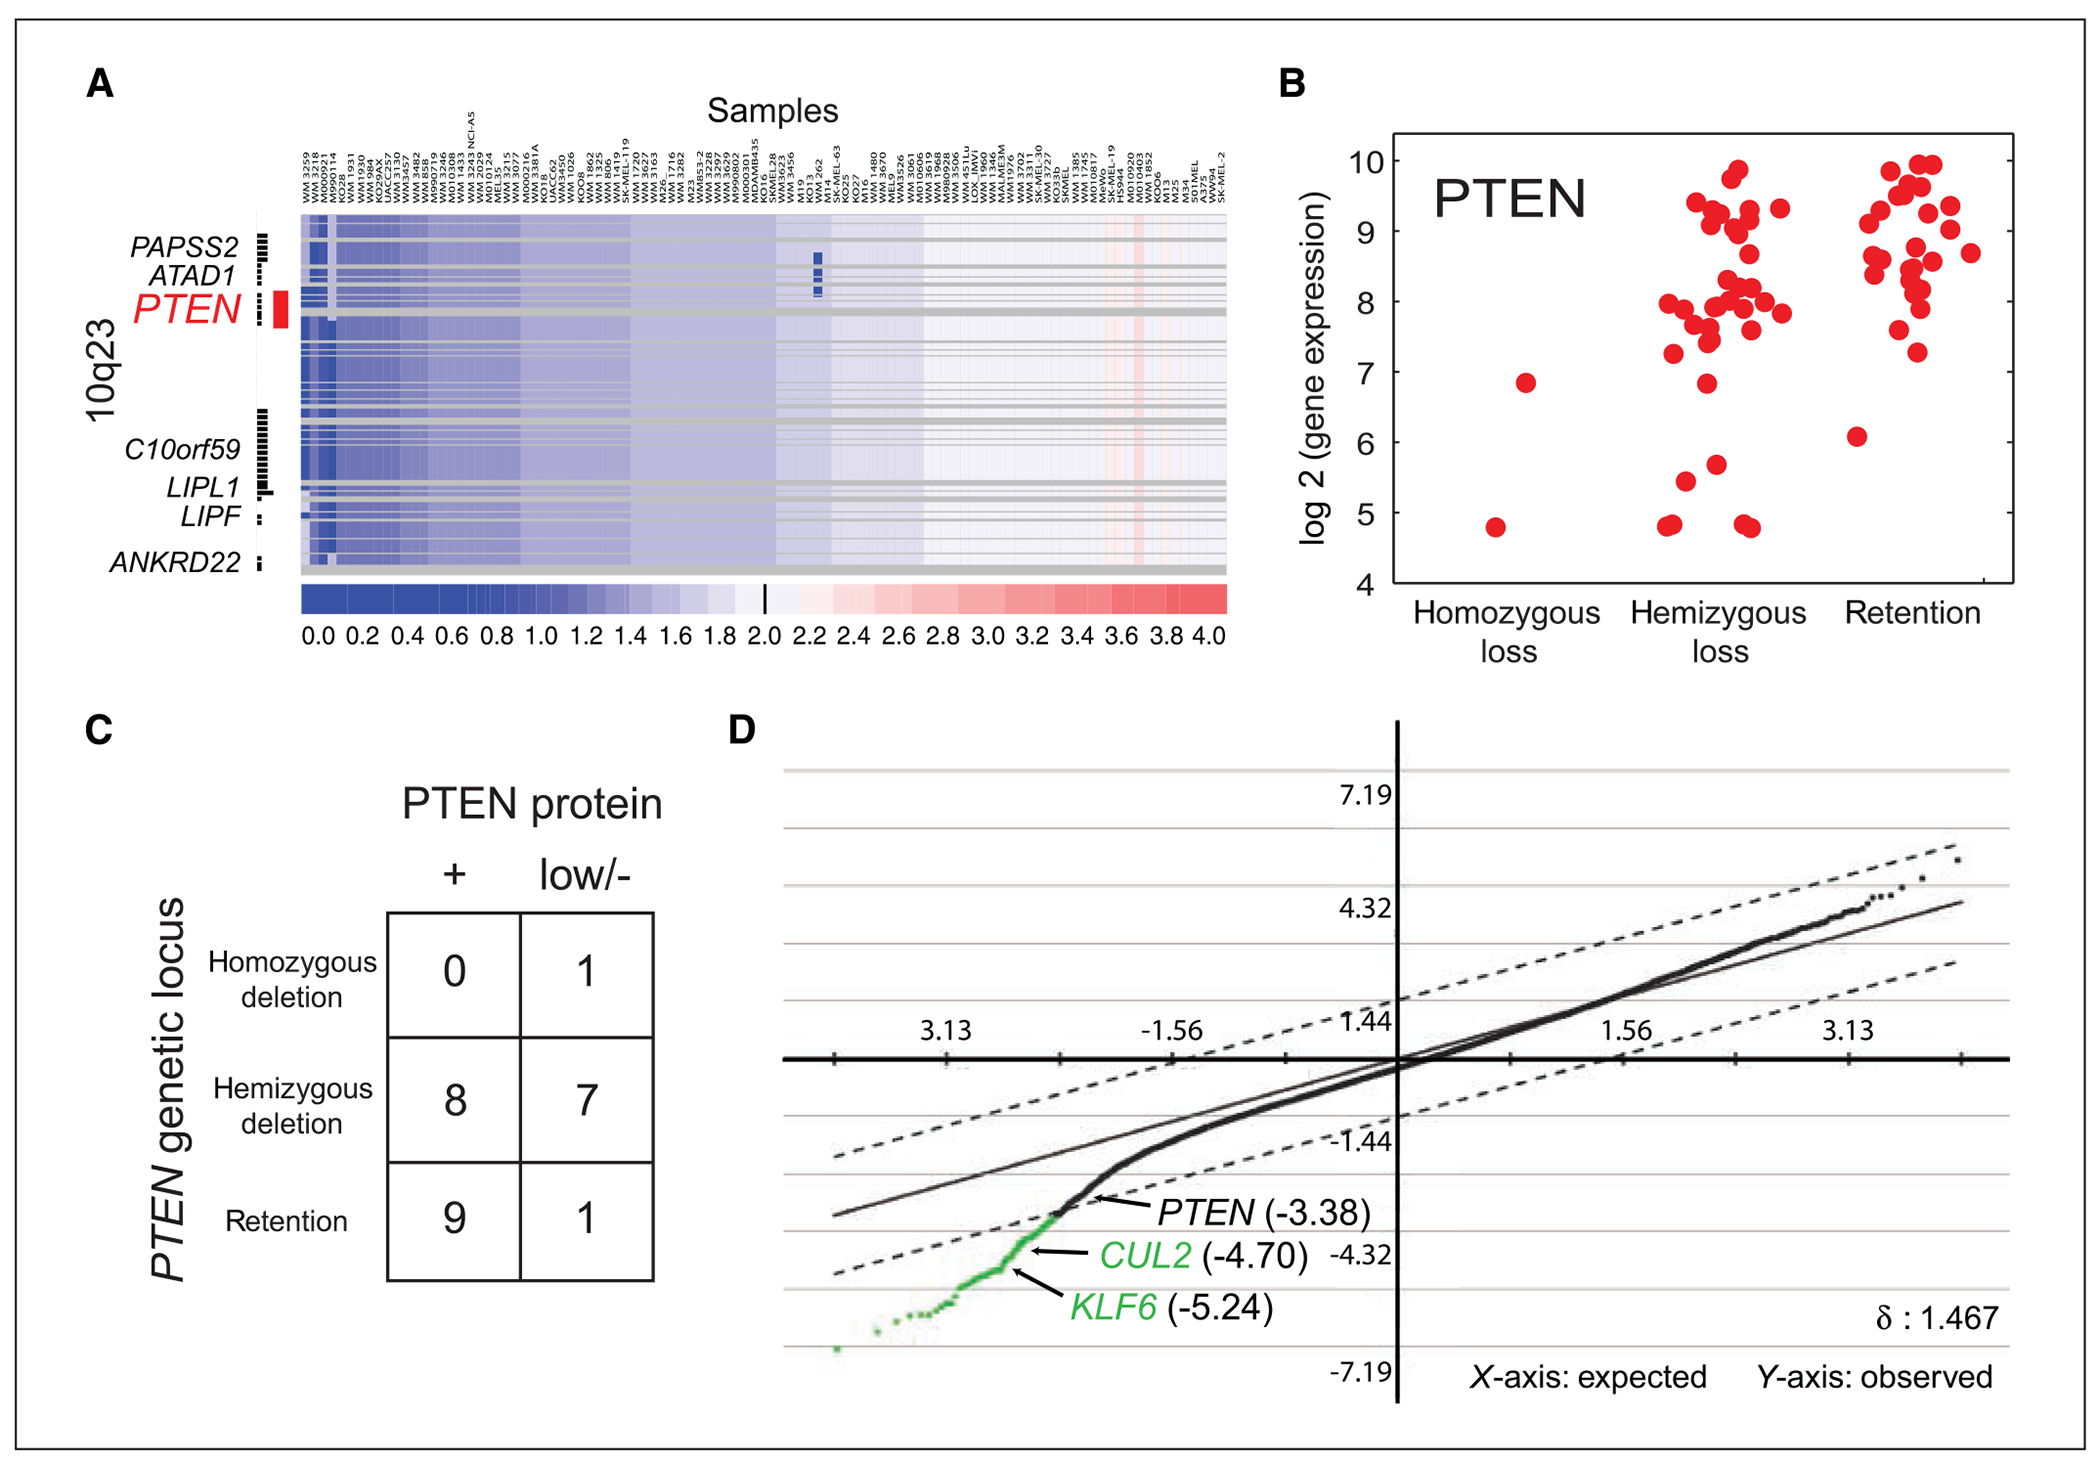
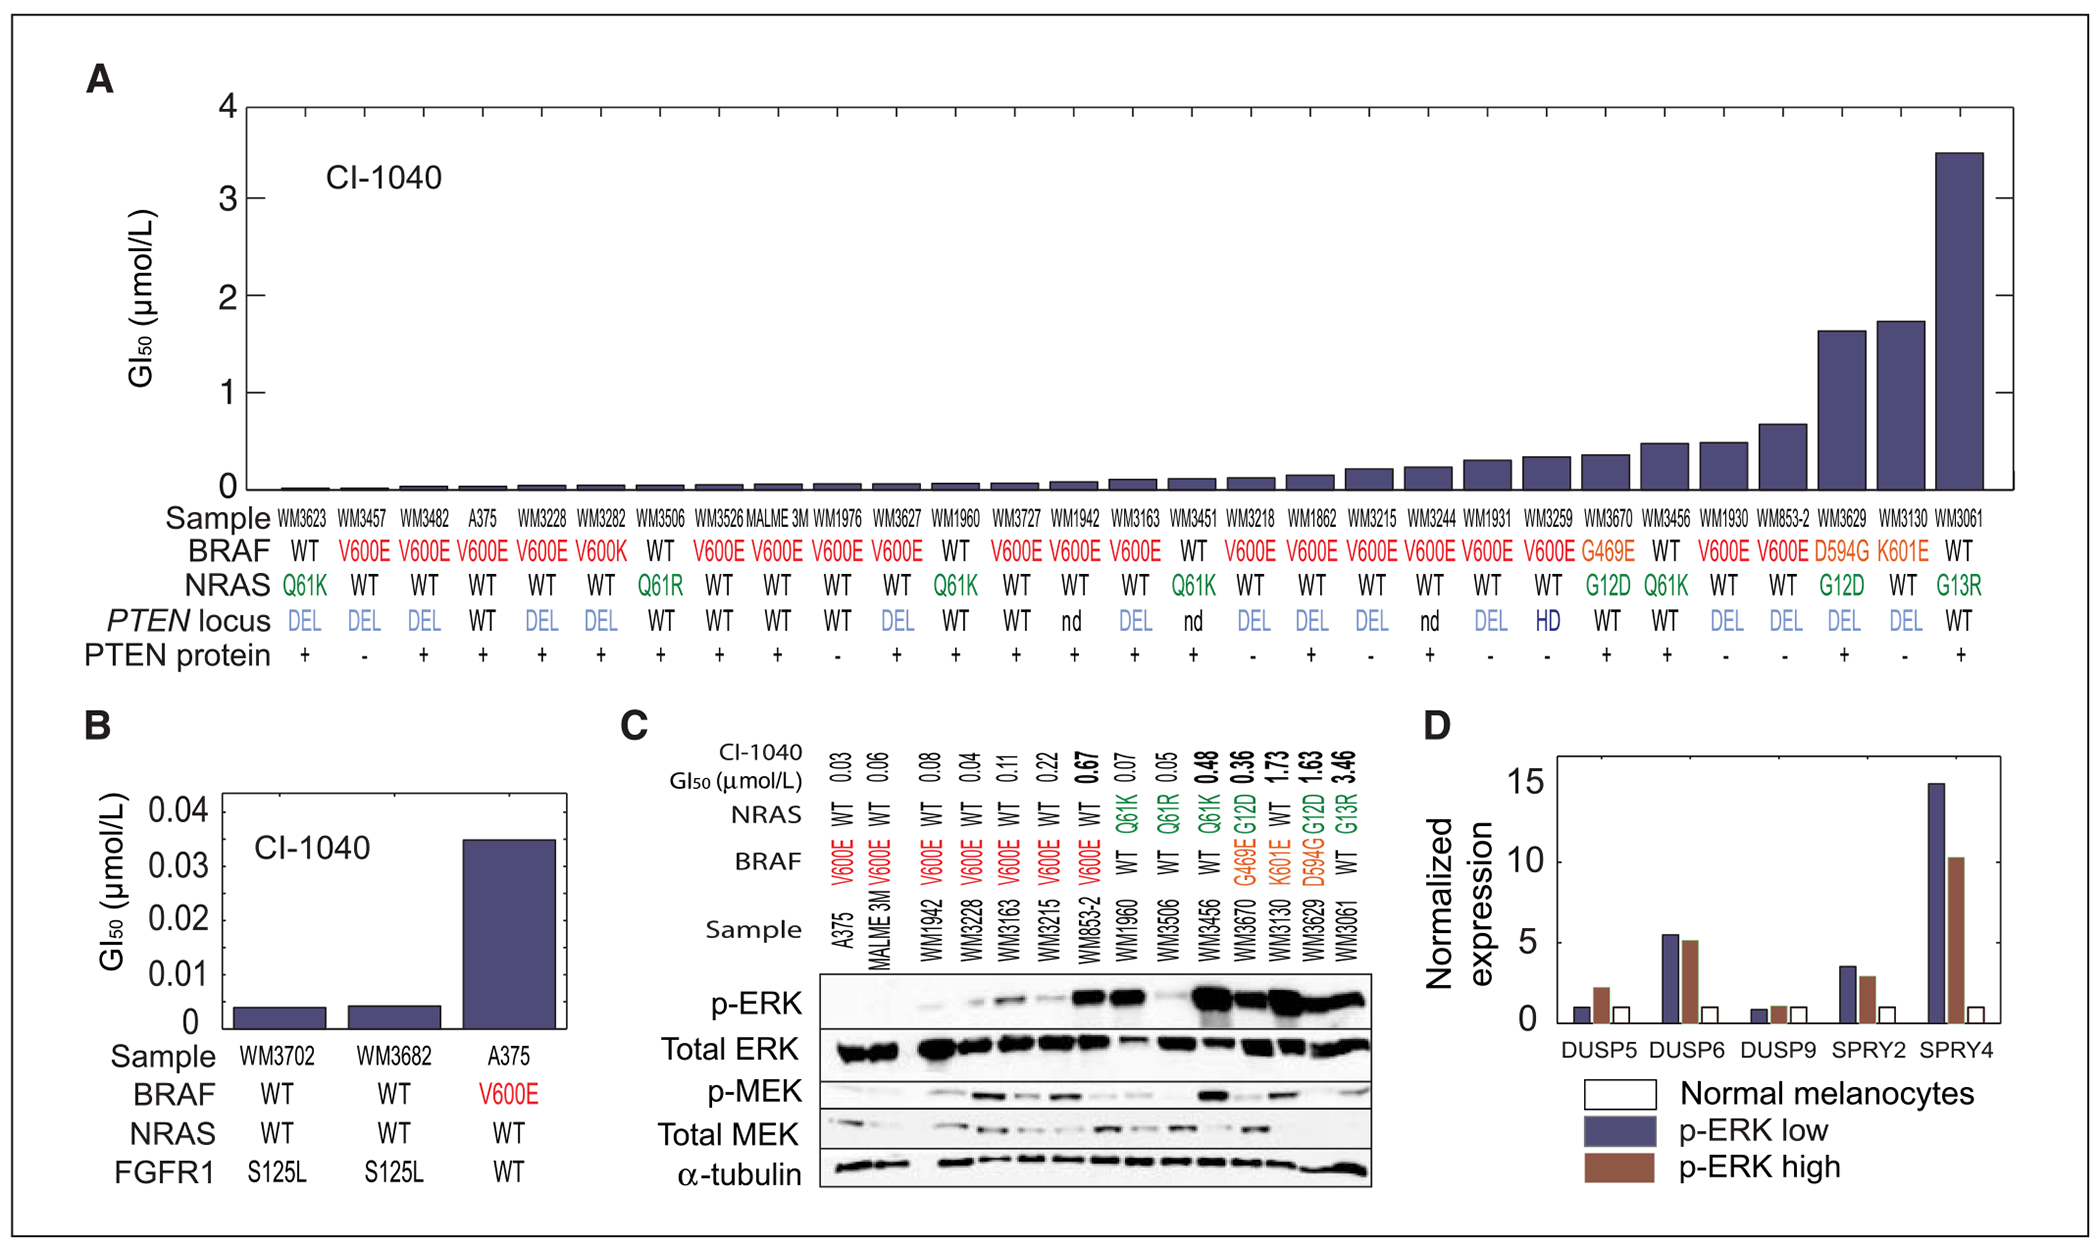
The classification of human tumors based on molecular criteria offers tremendous clinical potential; however, discerning critical and "druggable" effectors on a large scale will also require robust experimental models reflective of tumor genomic diversity. Here, we describe a comprehensive genomic analysis of 101 melanoma short-term cultures and cell lines. Using an analytic approach designed to enrich for putative "driver" events, we show that cultured melanoma cells encompass the spectrum of significant genomic alterations present in primary tumors. When annotated according to these lesions, melanomas cluster into subgroups suggestive of distinct oncogenic mechanisms. Integrating gene expression data suggests novel candidate effector genes linked to recurrent copy gains and losses, including both phosphatase and tensin homologue (PTEN)-dependent and PTEN-independent tumor suppressor mechanisms associated with chromosome 10 deletions. Finally, sample-matched pharmacologic data show that FGFR1 mutations and extracellular signal-regulated kinase (ERK) activation may modulate sensitivity to mitogen-activated protein kinase/ERK kinase inhibitors. Genetically defined cell culture collections therefore offer a rich framework for systematic functional studies in melanoma and other tumors.


Figures

Figure 1.
Figure 1.
Significant copy number and LOHalterations in melanoma. Statistically significant genomic amplifications (A) and deletions (B) pinpointed by GISTIC analysis of 101 cultured melanoma lines primarily from dermal metastases (dark red and dark blue, respectively) and 70 primary cutaneous melanomas (orange and light blue, respectively). Top axis, false discovery rate–corrected q values (threshold false discovery rate, 0.25; green line); left axis, chromosome; bottom axis, G-score (see text). C, GISTIC plot of inferred LOH (gray) is superimposed onto the chromosome deletion plot from B (dark blue) in cultured melanoma lines. Selected known melanoma oncogenes and tumor suppressors are indicated.
Figure 2.
Figure 2.
Clustering analysis of significant melanoma genomic alterations. Hierarchical clustering of GISTIC lesions (discretized smoothed copy number; see Materials and Methods) by the Euclidean distance metric and complete linkage. Rows, genomic lesions identified by GISTIC algorithm (see text); columns, samples. Red, presence; blue, absence of lesions denoted by cytobands (A, amplification; D, deletion; right). Mutation status of BRAF and NRAS are noted above the matrix. Major clusters are indicated by boxes labeled 1 to 6.
Figure 3.
Figure 3.
Integrative analysis of chromosome 10 deletions in melanoma. A, heatmap view of smoothed 250K and 50K SNP array data spanning the PTEN locus (red, copy gains; blue, copy losses). Samples (columns) are sorted based on copy number values derived from segmented data. B, PTEN gene expression values stratified according to homozygous deletion, hemizygous loss, or retention of the underlying locus. C, summary of PTEN protein levels in relation to chromosomal deletions affecting the PTEN locus. D, significance analysis of melanoma gene expression data. Samples are stratified according to loss or retention at chromosome 10 (see Materials and Methods). The positions of CUL2, KLF6, and PTEN are shown.
Figure 4.
Figure 4.
Molecular modifiers of MAP kinase dependency in melanoma. A, pharmacologic GI50 values for the MEK inhibitor CI-1040. Mutation status for BRAF and NRAS genes, genomic status at the PTEN locus, and PTEN protein levels are indicated. B, GI50 values for two short-term cultures harboring FGFR1 mutations are shown alongside a control melanoma cell line (A375). C, Western blot analyses of p-ERK, total ERK, p-MEK, total MEK, and α-tubulin are shown for selected melanoma lines (CI-1040 GI50 values are indicated). D, relative expression of MAP kinase feedback regulatory genes in melanoma lines with low or high p-ERK levels in relation to normal melanocytes.

References

    1. Vogelstein B, Kinzler KW. Cancer genes and the pathways they control. Nat Med 2004;10:789–99. - PubMed
    1. Weber BL. Cancer genomics. Cancer Cell 2002;1:37–47. - PubMed
    1. Kantarjian H, Sawyers C, Hochhaus A, et al. Hematologic and cytogenetic responses to imatinib mesylate in chronic myelogenous leukemia. N Engl J Med 2002;346:645–52. - PubMed
    1. Demetri GD, von Mehren M, Blanke CD, et al. Efficacy and safety of imatinib mesylate in advanced gastrointestinal stromal tumors. N Engl J Med 2002;347:472–80. - PubMed
    1. Paez JG, Janne PA, Lee JC, et al. EGFR mutations in lung cancer: correlation with clinical response to gefitinib therapy. Science 2004;304:1497–500. - PubMed

Publication types

MeSH terms