

Knock-in of an internal tandem duplication mutation into murine FLT3 confers myeloproliferative disease in a mouse model
- PMID: 18245664
- PMCID: PMC2275036
- DOI: 10.1182/blood-2007-08-109942
Knock-in of an internal tandem duplication mutation into murine FLT3 confers myeloproliferative disease in a mouse model
Abstract
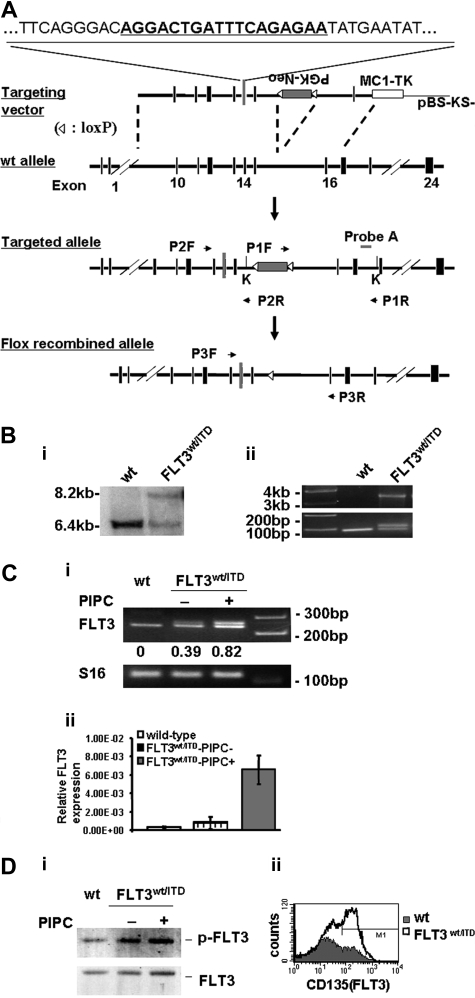
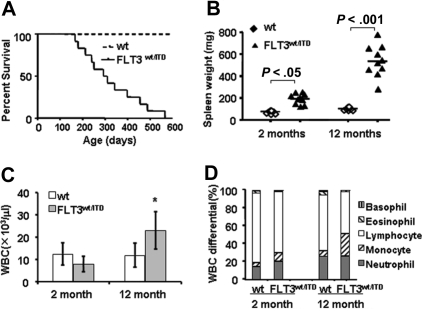
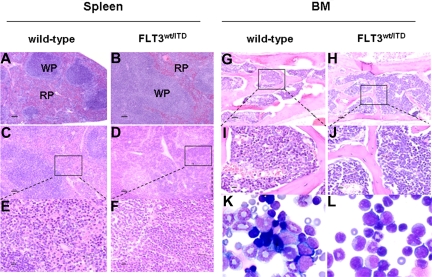
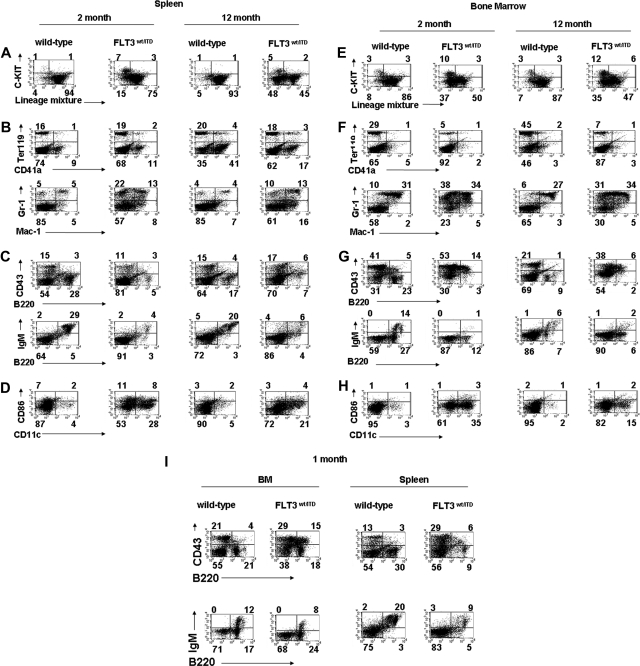
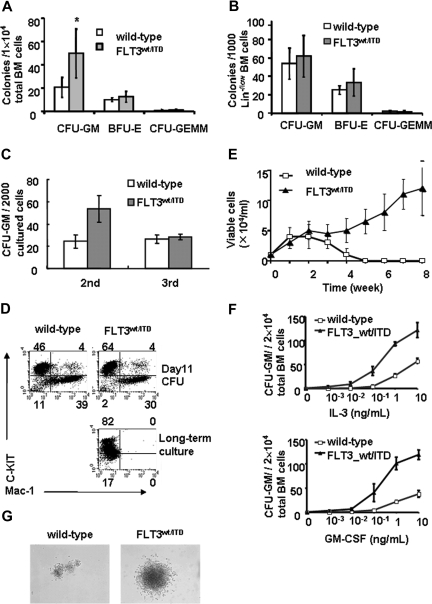
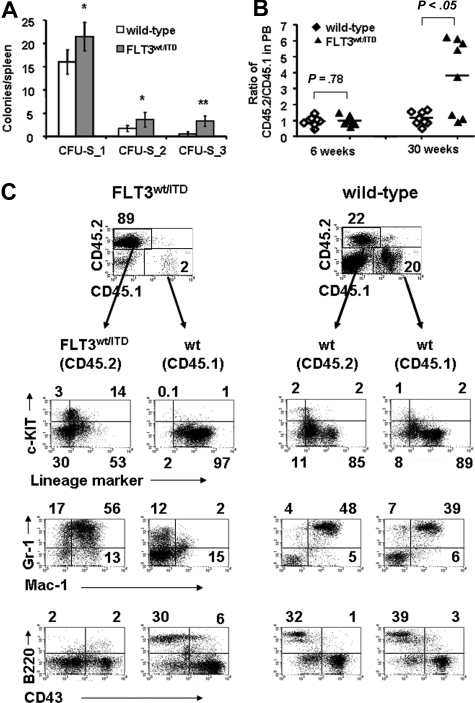
Constitutive activation of FMS-like tyrosine kinase 3 (FLT3) by internal tandem duplication (ITD) mutations is one of the most common molecular alterations known in acute myeloid leukemia (AML). To investigate the role FLT3/ITD mutations play in the development of leukemia, we generated a FLT3/ITD knock-in mouse model by inserting an ITD mutation into the juxtamembrane domain of murine Flt3. FLT3wt/ITD mice developed myeloproliferative disease, characterized by splenomegaly, leukocytosis, and myeloid hypercellularity, which progressed to mortality by 6 to 20 months. Bone marrow (BM) and spleen from FLT3wt/ITD mice had an increased fraction of granulocytes/monocytes and dendritic cells, and a decreased fraction of B-lymphocytes. No sign of acute leukemia was observed over the lifetime of these mice. BM from FLT3wt/ITD mice showed enhanced potential to generate myeloid colonies in vitro. BM from FLT3wt/ITD mice also produced more spleen colonies in the in vivo colony-forming unit (CFU)-spleen assay. In the long-term competitive repopulation assay, BM cells from FLT3wt/ITD mice outgrew the wild-type competitor cells and showed increased myeloid and reduced lymphoid expansion activity. In summary, our data indicate that expression of FLT3/ITD mutations alone is capable of conferring normal hematopoietic stem/progenitor cells (HSPCs) with enhanced myeloid expansion. It also appears to suppress B lymphoid maturation. Additional cooperative events appear to be required to progress to acute leukemia.
Figures
Similar articles
-
Roles of tyrosine 589 and 591 in STAT5 activation and transformation mediated by FLT3-ITD.Blood. 2006 Aug 15;108(4):1339-45. doi: 10.1182/blood-2005-11-011429. Epub 2006 Apr 20. Blood. 2006. PMID: 16627759 Free PMC article.
-
FLT3 internal tandem duplication mutations associated with human acute myeloid leukemias induce myeloproliferative disease in a murine bone marrow transplant model.Blood. 2002 Jan 1;99(1):310-8. doi: 10.1182/blood.v99.1.310. Blood. 2002. PMID: 11756186
-
Tyk2 is dispensable for induction of myeloproliferative disease by mutant FLT3.Int J Hematol. 2006 Jul;84(1):54-9. doi: 10.1532/IJH97.06016. Int J Hematol. 2006. PMID: 16867903
-
Biology, clinical relevance, and molecularly targeted therapy in acute leukemia with FLT3 mutation.Int J Hematol. 2006 May;83(4):301-8. doi: 10.1532/IJH97.06071. Int J Hematol. 2006. PMID: 16757428 Review.
-
Importance of PTM of FLT3 in acute myeloid leukemia.Acta Biochim Biophys Sin (Shanghai). 2024 Jun 24;56(8):1199-1207. doi: 10.3724/abbs.2024112. Acta Biochim Biophys Sin (Shanghai). 2024. PMID: 38915288 Free PMC article. Review.
Cited by
-
Integration of Hedgehog and mutant FLT3 signaling in myeloid leukemia.Sci Transl Med. 2015 Jun 10;7(291):291ra96. doi: 10.1126/scitranslmed.aaa5731. Sci Transl Med. 2015. PMID: 26062848 Free PMC article.
-
Defective nonhomologous end joining blocks B-cell development in FLT3/ITD mice.Blood. 2011 Mar 17;117(11):3131-9. doi: 10.1182/blood-2010-05-286070. Epub 2011 Jan 12. Blood. 2011. PMID: 21228325 Free PMC article.
-
Integrative analysis of type-I and type-II aberrations underscores the genetic heterogeneity of pediatric acute myeloid leukemia.Haematologica. 2011 Oct;96(10):1478-87. doi: 10.3324/haematol.2010.038976. Epub 2011 Jul 26. Haematologica. 2011. PMID: 21791472 Free PMC article.
-
Lack of CD45 in FLT3-ITD mice results in a myeloproliferative phenotype, cortical porosity, and ectopic bone formation.Oncogene. 2019 Jun;38(24):4773-4787. doi: 10.1038/s41388-019-0757-y. Epub 2019 Feb 28. Oncogene. 2019. PMID: 30820040
-
Myeloproliferative neoplasm animal models.Hematol Oncol Clin North Am. 2012 Oct;26(5):1065-81. doi: 10.1016/j.hoc.2012.07.007. Epub 2012 Aug 21. Hematol Oncol Clin North Am. 2012. PMID: 23009938 Free PMC article. Review.
References
-
- McKenna HJ, Stocking KL, Miller RE, et al. Mice lacking flt3 ligand have deficient hematopoiesis affecting hematopoietic progenitor cells, dendritic cells, and natural killer cells. Blood. 2000;95:3489–3497. - PubMed
-
- Rosnet O, Schiff C, Pebusque MJ, et al. Human FLT3/FLK2 gene: cDNA cloning and expression in hematopoietic cells. Blood. 1993;82:1110–1119. - PubMed
-
- Zeigler FC, Bennett BD, Jordan CT, et al. Cellular and molecular characterization of the role of the flk-2/flt-3 receptor tyrosine kinase in hematopoietic stem cells. Blood. 1994;84:2422–2430. - PubMed
-
- Gilliland DG, Griffin JD. The roles of FLT3 in hematopoiesis and leukemia. Blood. 2002;100:1532–1542. - PubMed
Publication types
MeSH terms
Substances
Grants and funding
LinkOut - more resources
Full Text Sources
Other Literature Sources
Medical
Molecular Biology Databases
Miscellaneous
