

Development and application of a phylogenomic toolkit: resolving the evolutionary history of Madagascar's lemurs
- PMID: 18245770
- PMCID: PMC2259113
- DOI: 10.1101/gr.7265208
Development and application of a phylogenomic toolkit: resolving the evolutionary history of Madagascar's lemurs
Abstract
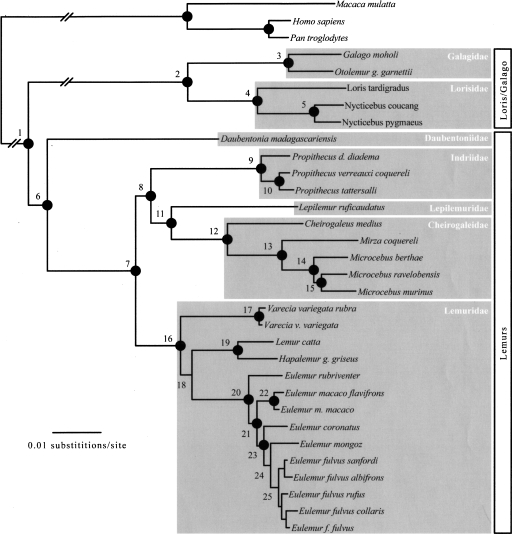
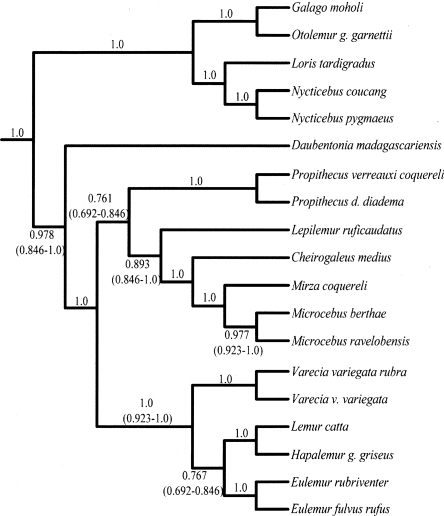
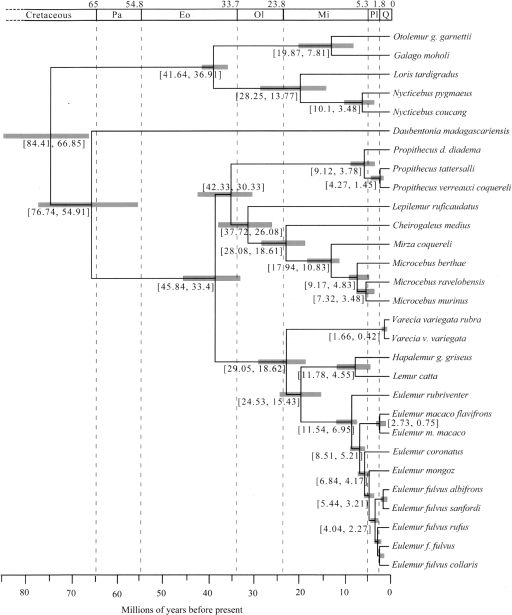
Lemurs and the other strepsirrhine primates are of great interest to the primate genomics community due to their phylogenetic placement as the sister lineage to all other primates. Previous attempts to resolve the phylogeny of lemurs employed limited mitochondrial or small nuclear data sets, with many relationships poorly supported or entirely unresolved. We used genomic resources to develop 11 novel markers from nine chromosomes, representing approximately 9 kb of nuclear sequence data. In combination with previously published nuclear and mitochondrial loci, this yields a data set of more than 16 kb and adds approximately 275 kb of DNA sequence to current databases. Our phylogenetic analyses confirm hypotheses of lemuriform monophyly and provide robust resolution of the phylogenetic relationships among the five lemuriform families. We verify that the genus Daubentonia is the sister lineage to all other lemurs. The Cheirogaleidae and Lepilemuridae are sister taxa and together form the sister lineage to the Indriidae; this clade is the sister lineage to the Lemuridae. Divergence time estimates indicate that lemurs are an ancient group, with their initial diversification occurring around the Cretaceous-Tertiary boundary. Given the power of this data set to resolve branches in a notoriously problematic area of primate phylogeny, we anticipate that our phylogenomic toolkit will be of value to other studies of primate phylogeny and diversification. Moreover, the methods applied will be broadly applicable to other taxonomic groups where phylogenetic relationships have been notoriously difficult to resolve.
Figures
References
-
- Adkins R.M., Honeycutt R.L., Honeycutt R.L. Evolution of the primate cytochrome c oxidase subunit II gene. J. Mol. Evol. 1994;38:215–231. - PubMed
-
- Ane C., Larget B., Baum D.A., Smith S.D., Rokas A., Larget B., Baum D.A., Smith S.D., Rokas A., Baum D.A., Smith S.D., Rokas A., Smith S.D., Rokas A., Rokas A. Bayesian estimation of concordance among gene trees. Mol. Biol. Evol. 2007;24:412–426. - PubMed
-
- Arnason U., Gullberg A., Burguete A.S., Janke A., Gullberg A., Burguete A.S., Janke A., Burguete A.S., Janke A., Janke A. Molecular estimates of primate divergences and new hypotheses for primate dispersal and the origin of modern humans. Hereditas. 2000;133:217–228. - PubMed
-
- Bapteste E., Brinkmann H., Lee J.A., Moore D.V., Sensen C.W., Gordon P., Durufle L., Gaasterland T., Lopez P., Muller M., Brinkmann H., Lee J.A., Moore D.V., Sensen C.W., Gordon P., Durufle L., Gaasterland T., Lopez P., Muller M., Lee J.A., Moore D.V., Sensen C.W., Gordon P., Durufle L., Gaasterland T., Lopez P., Muller M., Moore D.V., Sensen C.W., Gordon P., Durufle L., Gaasterland T., Lopez P., Muller M., Sensen C.W., Gordon P., Durufle L., Gaasterland T., Lopez P., Muller M., Gordon P., Durufle L., Gaasterland T., Lopez P., Muller M., Durufle L., Gaasterland T., Lopez P., Muller M., Gaasterland T., Lopez P., Muller M., Lopez P., Muller M., Muller M., et al. The analysis of 100 genes supports the grouping of three highly divergent amoebae: Dictyostelium, Entamoeba, and Mastigamoeba. Proc. Natl. Acad. Sci. 2002;99:1414–1419. - PMC - PubMed
-
- Brumfield R.T., Beerli P., Nickerson D.A., Edwards S.V., Beerli P., Nickerson D.A., Edwards S.V., Nickerson D.A., Edwards S.V., Edwards S.V. The utility of single nucleotide polymorphisms in inferences of population history. Trends Ecol. Evol. 2003;18:249–256.
Publication types
MeSH terms
Substances
Associated data
- Actions
- Actions
- Actions
- Actions
- Actions
- Actions
- Actions
- Actions
- Actions
- Actions
- Actions
- Actions
- Actions
- Actions
- Actions
- Actions
- Actions
- Actions
- Actions
- Actions
- Actions
- Actions
- Actions
- Actions
- Actions
LinkOut - more resources
Full Text Sources
Research Materials