. 2008 May;49(5):1056-67.
doi: 10.1194/jlr.M800013-JLR200. Epub 2008 Feb 2.

Glucocorticoids and cyclic AMP selectively increase hepatic lipin-1 expression, and insulin acts antagonistically

Affiliations

Glucocorticoids and cyclic AMP selectively increase hepatic lipin-1 expression, and insulin acts antagonistically

Boripont Manmontri et al. J Lipid Res. 2008 May.

Abstract

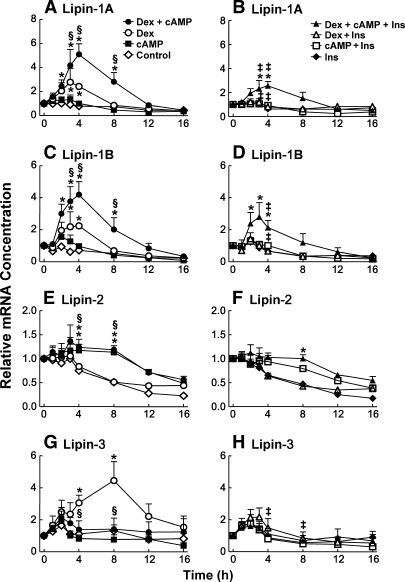
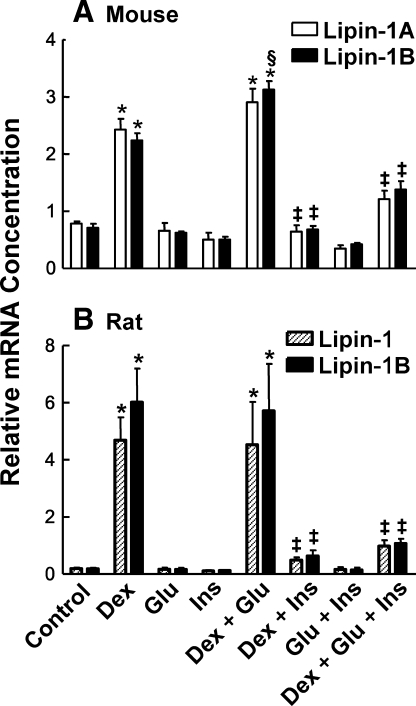
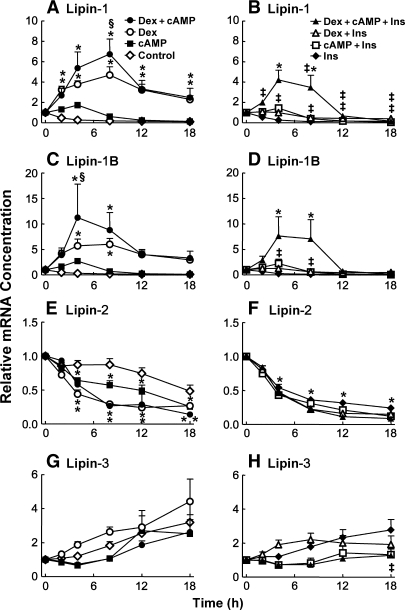
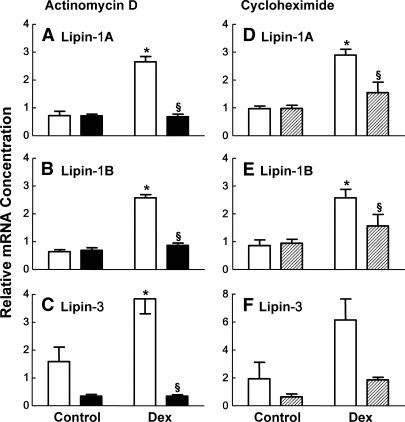
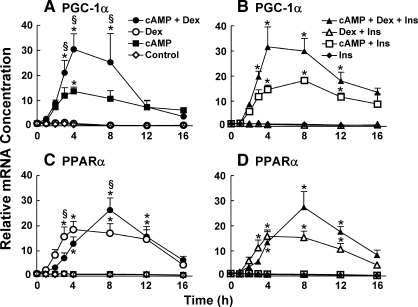
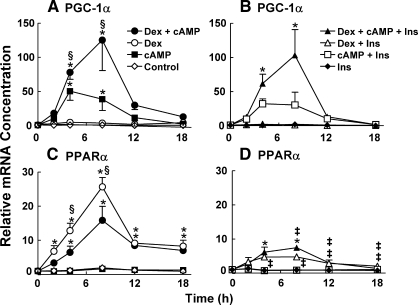
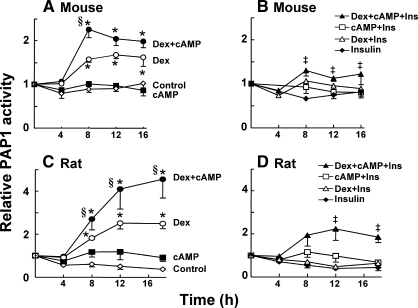
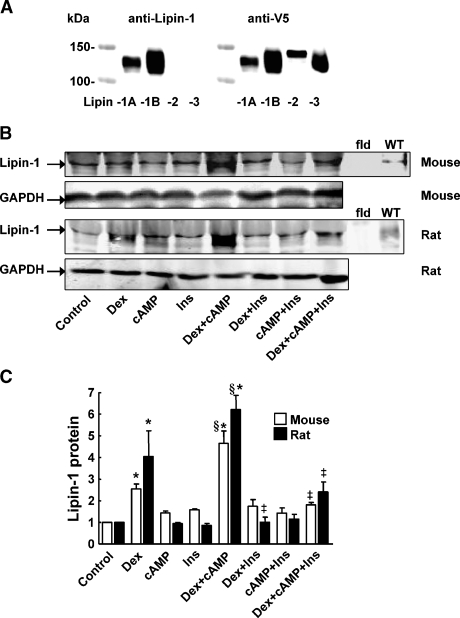
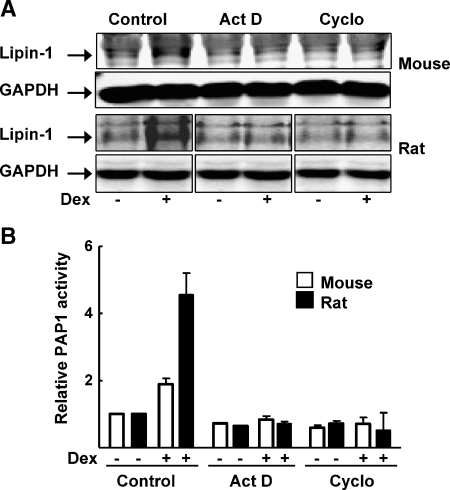
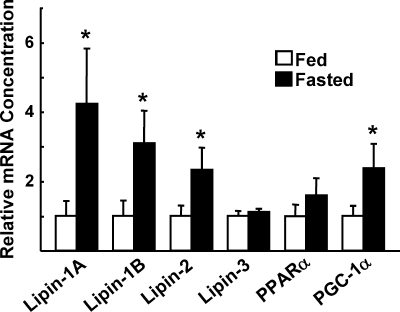
Glucocorticoids (GCs) increase hepatic phosphatidate phosphatase (PAP1) activity. This is important in enhancing the liver's capacity for storing fatty acids as triacylglycerols (TAGs) that can be used subsequently for beta-oxidation or VLDL secretion. PAP1 catalyzes the conversion of phosphatidate to diacylglycerol, a key substrate for TAG and phospholipid biosynthesis. PAP1 enzymes in liver include lipin-1A and -1B (alternatively spliced isoforms) and two distinct gene products, lipin-2 and lipin-3. We determined the mechanisms by which the composite PAP1 activity is regulated using rat and mouse hepatocytes. Levels of lipin-1A and -1B mRNA were increased by dexamethasone (dex; a synthetic GC), and this resulted in increased lipin-1 synthesis, protein levels, and PAP1 activity. The stimulatory effect of dex on lipin-1 expression was enhanced by glucagon or cAMP and antagonized by insulin. Lipin-2 and lipin-3 mRNA were not increased by dex/cAMP, indicating that increased PAP1 activity is attributable specifically to enhanced lipin-1 expression. This work provides the first evidence for the differential regulation of lipin activities. Selective lipin-1 expression explains the GC and cAMP effects on increased hepatic PAP1 activity, which occurs in hepatic steatosis during starvation, diabetes, stress, and ethanol consumption.


Figures

Fig. 1.
Fig. 1.
Interaction of dexamethasone (dex), cAMP, and insulin in controlling mRNA expression for lipin in mouse hepatocytes. Mouse hepatocytes were incubated for the times shown with 100 nM dex (Dex), 100 μM 8-(4-chlorophenylthio) cyclic AMP (CPTcAMP; cAMP), and 100 nM insulin (Ins) alone or in combination as indicated. Relative mRNA concentrations for the different lipins were measured (A–H) by real-time RT-PCR and expressed relative to that for cyclophilin A. Results are expressed as means ± SEM for 3–15 independent experiments. The significance of the differences (P < 0.05) is indicated as follows: * different from the untreated control value; § dex alone different from dex + CPTcAMP treatment; incubation with insulin decreases the effect of dex alone or dex + CPTcAMP.
Fig. 2.
Fig. 2.
Interaction of dex, glucagon, and insulin in controlling mRNA expression for lipin-1 in mouse and rat hepatocytes. Mouse (A) and rat (B) hepatocytes were incubated for 4 and 8 h, respectively, with 100 nM dex (Dex), 10 nM glucagon (Glu), and 100 nM insulin (Ins) alone or in combination as indicated. The relative mRNA concentrations for the different lipins were measured by real-time RT-PCR and expressed relative to that for cyclophilin A. Results are means ± SEM for 3–15 independent experiments for the mouse and for 3 to 8 experiments for the rat. The significance of the differences (P < 0.05) is indicated as follows: * different from the untreated control value; § dex alone is significantly different from dex + CPTcAMP treatment; incubation with insulin decreases the effect of dex alone or dex + glucagon.
Fig. 3.
Fig. 3.
Interaction of dex, cAMP, and insulin in controlling mRNA expression for lipin in rat hepatocytes. Rat hepatocytes were incubated for various times with 100 nM dex (Dex), 100 μM CPTcAMP (cAMP), and 100 nM insulin (Ins) alone or in combination as indicated. The relative mRNA concentrations for the different lipins were measured (A–H) by real-time RT-PCR and expressed relative to that for cyclophilin A. Results are expressed as means ± SEM for three to eight independent experiments. The significance of the differences (P < 0.05) is indicated as follows: * different from the untreated control value; § dex alone different from dex + CPTcAMP treatment; incubation with insulin decreases the effect of dex alone or dex + CPTcAMP.
Fig. 4.
Fig. 4.
Effects of actinomycin D and cycloheximide on the dex-induced increase in mRNA for lipin-1A, -1B, and -3. Mouse hepatocytes were treated with or without dex (Dex) in the presence or absence of 10 μg/ml actinomycin D (cells were also preincubated for 30 min with actinomycin D) (A–C) or 5 μg/ml cycloheximide (D–F). To measure mRNA production for lipin-1A and -1B or lipin-3, the hepatocytes were incubated for 4 or 8 h, respectively, based upon the time required to achieve optimum stimulation of mRNA production as show in Fig. 1. White columns show values for incubations in the absence of inhibitor, whereas black and hatched columns indicate the presence of actinomycin D and cycloheximide, respectively. Results are means ± SEM for three independent experiments, except for F, where means ± ranges are shown for two experiments. The significance of the differences (P < 0.05), as evaluated with a Student's t-test, is indicated as follows: * dex treatment different from the untreated control value; § the actinomycin D or cycloheximide result is different from the equivalent incubation without these inhibitors.
Fig. 5.
Fig. 5.
Interaction of dex, cAMP, and insulin in controlling mRNA expression for peroxisome proliferator-activated receptor α (PPARα) and peroxisome proliferator-activated receptor-coactivator-1α (PGC-1α) in mouse hepatocytes. Mouse hepatocytes were incubated for the times shown with 100 nM dex (Dex), 100 μM CPTcAMP (cAMP), and 100 nM insulin (Ins) alone or in combination as indicated. Relative mRNA concentrations for PGC-1α (A, B) and PPARα (C, D) were measured by real-time RT-PCR and expressed relative to that for cyclophilin A. Results are expressed as means ± SEM for three independent experiments. The significance of the differences (P < 0.05) is indicated as follows: * different from the untreated control value; § dex alone different from dex + CPTcAMP treatment.
Fig. 6.
Fig. 6.
Interaction of dex, cAMP, and insulin in controlling mRNA expression for PPARα and PGC-1α in rat hepatocytes. Rat hepatocytes were incubated for the times shown with 100 nM dex (Dex), 100 μM CPTcAMP (cAMP), and 100 nM insulin (Ins) alone or in combination as indicated. Relative mRNA concentrations for PGC-1α (A, B) and PPARα (C, D) were measured by real-time RT-PCR and expressed relative to that for cyclophilin A. Results are expressed as means ± SEM for three independent experiments. The significance of the differences (P < 0.05) is indicated as follows: * different from the untreated control value; § dex alone different from dex + CPTcAMP treatment; incubation with insulin decreases the effect of dex alone or dex + CPTcAMP.
Fig. 7.
Fig. 7.
Interaction of dex, glucagon, and insulin in controlling phosphatidate phosphatase (PAP1) activity in mouse and rat hepatocytes. Mouse (A, B) and rat (C, D) hepatocytes were incubated for various times with 100 nM dex (Dex), 100 μM CPTcAMP (cAMP), and 100 nM insulin (Ins) alone or in combination as indicated. The average PAP1 specific activities at the beginning of the incubation were 32 ± 15 (n = 7) and 36 ± 12 (n = 5) nmol diacylglycerol produced per min per mg protein for mouse and rat hepatocytes, respectively. The results are expressed relative to the initial untreated value, which was normalized to 1. Results are means ± SEM for three to nine independent experiments. The significance of the differences (P < 0.05) is indicated as follows: * different from the untreated control value; § dex alone is significantly different from dex + CPTcAMP treatment; incubation with insulin decreases the effect of dex alone or dex + CPTcAMP.
Fig. 8.
Fig. 8.
Interaction of dex, glucagon, and insulin in controlling lipin-1 expression in mouse and rat hepatocytes. A: Western blots for different V5-tagged lipins that were detected simultaneously with a rabbit polyclonal anti-lipin-1 antibody and a mouse monoclonal anti-V5 antibody. B: Representative Western blots for mouse and rat hepatocytes that were incubated for 8 and 12 h, respectively, with 100 nM dex (Dex), 100 μM CPTcAMP (cAMP), and 100 nM insulin (Ins) alone or in combination as indicated. A marker for lipin-1 is shown on the right side, where adipose tissue extracts from wild-type (WT) and fld mice were used. The lower Western blots are for GAPDH, which was used as a loading control. C: Means ± SEM for the relative expression of lipin-1 after normalization against GAPDH for each treatment. Results are for three to four independent experiments. The significance of the differences (P < 0.05) is indicated as follows: * different from the untreated control value; § dex alone is significantly different from dex + CPTcAMP treatment; incubation with insulin decreases the effect of dex alone or dex + CPTcAMP.
Fig. 9.
Fig. 9.
Actinomycin D and cycloheximide block the dex-induced expression of lipin-1 and PAP1 activity. Mouse and rat hepatocytes were preincubated with or without 10 μg/ml actinomycin D (Act D) or 5 μg/ml cycloheximide (Cyclo) for 30 min. The inhibitors were maintained in the subsequent incubations in the presence or absence of 100 nM dex, which for mouse and rat hepatocytes were 8 and 12 h, respectively. These times were based upon the results in Fig. 4. A: Representative Western blots. B: PAP1 activity relative to the equivalent incubation in the absence of inhibitors or dex. Results are means ± SEM for three independent experiments with mouse hepatocytes and means ± ranges for two experiments with rat hepatocytes.
Fig. 10.
Fig. 10.
Effects of fasting on mRNA expression for the lipins, PPARα, and PGC-1α in mouse liver. mRNA concentrations were measured by real-time PCR in livers from C57BL/6J mice that were fasted for 16 h (fasted samples) or fasted for 16 h and refed for 4 h (fed samples). Results are means ± SD for three mice in each group, and significant differences compared with the fed values are indicated (* P < 0.05).

Similar articles

Cited by

References

    1. Jamal Z., A. Martin, A. Gomez-Munoz, and D. N. Brindley. 1991. Plasma membrane fractions from rat liver contain a phosphatidate phosphohydrolase distinct from that in the endoplasmic reticulum and cytosol. J. Biol. Chem. 266 2988–2996. - PubMed
    1. Brindley D. N. 2004. Lipid phosphate phosphatases and related proteins: signaling functions in development, cell division, and cancer. J. Cell. Biochem. 92 900–912. - PubMed
    1. Donkor J., M. Sariahmetoglu, J. Dewald, D. N. Brindley, and K. Reue. 2007. Three mammalian lipins act as phosphatidate phosphatases with distinct tissue expression patterns. J. Biol. Chem. 282 3450–3457. - PubMed
    1. Han G. S., W. I. Wu, and G. M. Carman. 2006. The Saccharomyces cerevisiae lipin homolog is a Mg2+-dependent phosphatidate phosphatase enzyme. J. Biol. Chem. 281 9210–9218. - PMC - PubMed
    1. Brindley, D. N. 1988. Phosphatidate Phosphohydrolase: Its Role in Glycerolipid Synthesis. CRC Press, Boca Raton, FL. 21–77.

Publication types

MeSH terms