

Genetic modification of the schisis phenotype in a mouse model of X-linked retinoschisis
- PMID: 18245825
- PMCID: PMC2278062
- DOI: 10.1534/genetics.107.084905
Genetic modification of the schisis phenotype in a mouse model of X-linked retinoschisis
Abstract
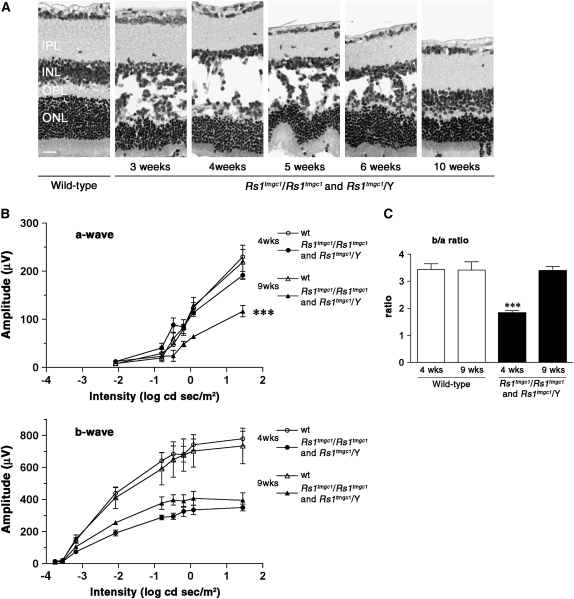
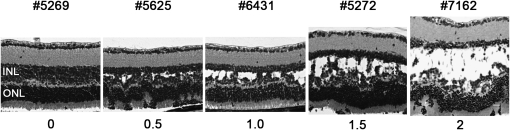
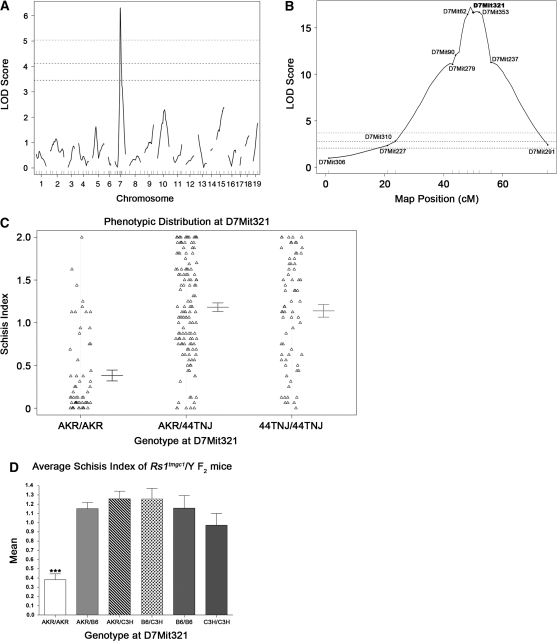
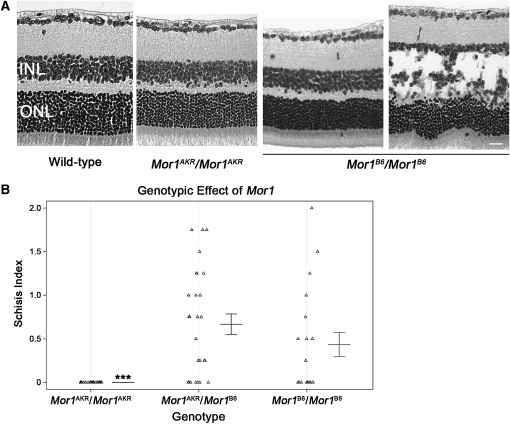
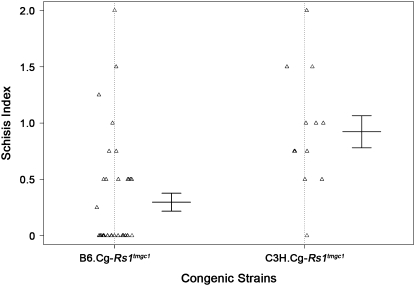
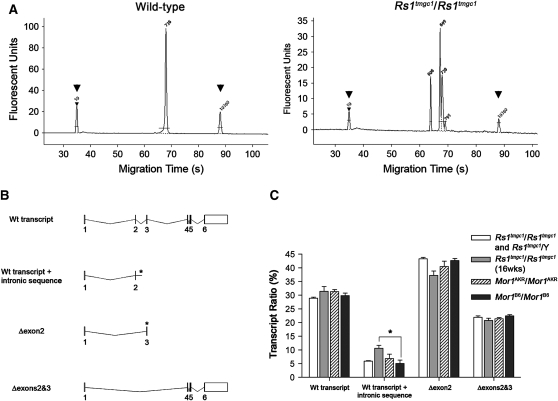
X-linked retinoschisis (XLRS) is an inherited form of macular degeneration that is caused by mutations in the retinoschisin (RS1) gene. In addition to macular degeneration, other major characteristics of XLRS include splitting of the retina (schisis) and impaired synaptic transmission as indicated by a reduction in the electroretinogram b-wave. It has been known that patients carrying RS1 mutations show a broad range of phenotypic variability. Interestingly, phenotypic variation is observed even among family members with the same RS1 mutation, suggesting the existence of genetic or environmental factors that contribute to the severity of XLRS. However, in the human population, the cause of phenotypic variability and the contribution of genetic modifiers for this relatively rare disease are difficult to study and poorly understood. In this study, using a mouse model for XLRS, we show that genetic factors can contribute to the severity of the retinoschisis phenotype. We report evidence of a major genetic modifier of Rs1, which affects the disease severity in these animals. A quantitative trait locus (QTL), named modifier of Rs1 1 (Mor1), is mapped on chromosome (Chr) 7. When homozygous, the Mor1 allele from the inbred mouse strain AKR/J diminishes the severity of the schisis phenotype in Rs1(tmgc1)/Y male and Rs1(tmgc1)/Rs1(tmgc1) female mice. We also show that the penetrance of the disease phenotype is affected by additional genetic factor(s). Our study suggests that multiple genetic modifiers could potentially be responsible for the phenotypic variation in human XLRS.
Figures
Similar articles
-
Tyrosinase is the modifier of retinoschisis in mice.Genetics. 2010 Dec;186(4):1337-44. doi: 10.1534/genetics.110.120840. Epub 2010 Sep 27. Genetics. 2010. PMID: 20876567 Free PMC article.
-
Of men and mice: Human X-linked retinoschisis and fidelity in mouse modeling.Prog Retin Eye Res. 2022 Mar;87:100999. doi: 10.1016/j.preteyeres.2021.100999. Epub 2021 Aug 11. Prog Retin Eye Res. 2022. PMID: 34390869 Review.
-
Null retinoschisin-protein expression from an RS1 c354del1-ins18 mutation causing progressive and severe XLRS in a cross-sectional family study.Invest Ophthalmol Vis Sci. 2009 Nov;50(11):5375-83. doi: 10.1167/iovs.09-3839. Epub 2009 May 27. Invest Ophthalmol Vis Sci. 2009. PMID: 19474399 Free PMC article.
-
An ex vivo gene therapy approach in X-linked retinoschisis.Mol Vis. 2016 Jun 24;22:718-33. eCollection 2016. Mol Vis. 2016. PMID: 27390514 Free PMC article.
-
Advances in understanding the molecular structure of retinoschisin while questions remain of biological function.Prog Retin Eye Res. 2023 Jul;95:101147. doi: 10.1016/j.preteyeres.2022.101147. Epub 2022 Nov 16. Prog Retin Eye Res. 2023. PMID: 36402656 Free PMC article. Review.
Cited by
-
Phenotypic expression of X-linked retinoschisis in Chinese families with mutations in the RS1 gene.Doc Ophthalmol. 2011 Aug;123(1):21-7. doi: 10.1007/s10633-011-9278-x. Epub 2011 Jun 24. Doc Ophthalmol. 2011. PMID: 21701876
-
Genetic modifiers as relevant biological variables of eye disorders.Hum Mol Genet. 2017 Aug 1;26(R1):R58-R67. doi: 10.1093/hmg/ddx180. Hum Mol Genet. 2017. PMID: 28482014 Free PMC article. Review.
-
Genetic variations strongly influence phenotypic outcome in the mouse retina.PLoS One. 2011;6(7):e21858. doi: 10.1371/journal.pone.0021858. Epub 2011 Jul 14. PLoS One. 2011. PMID: 21779340 Free PMC article.
-
The severity of retinal degeneration in Rp1h gene-targeted mice is dependent on genetic background.Invest Ophthalmol Vis Sci. 2009 Apr;50(4):1566-74. doi: 10.1167/iovs.08-2776. Epub 2008 Dec 5. Invest Ophthalmol Vis Sci. 2009. PMID: 19060274 Free PMC article.
-
Genetic modification of corneal neovascularization in Dstn (corn1) mice.Mamm Genome. 2013 Oct;24(9-10):349-57. doi: 10.1007/s00335-013-9468-9. Epub 2013 Aug 9. Mamm Genome. 2013. PMID: 23929036 Free PMC article.
References
-
- Apushkin, M. A., G. A. Fishman and A. S. Rajagopalan, 2005. Fundus findings and longitudinal study of visual acuity loss in patients with X-linked retinoschisis. Retina 25 612–618. - PubMed
-
- Broman, K. W., H. Wu, S. Sen and G. A. Churchill, 2003. R/qtl: QTL mapping in experimental crosses. Bioinformatics 19 889–890. - PubMed
-
- Buchner, D. A., M. Trudeau and M. H. Meisler, 2003. SCNM1, a putative RNA splicing factor that modifies disease severity in mice. Science 301 967–969. - PubMed
Publication types
MeSH terms
Substances
Grants and funding
LinkOut - more resources
Full Text Sources
Molecular Biology Databases
