. 2008 Mar;11(3):360-6.
doi: 10.1038/nn2049. Epub 2008 Feb 3.

Top-down laminar organization of the excitatory network in motor cortex

Affiliations

Top-down laminar organization of the excitatory network in motor cortex

Nicholas Weiler et al. Nat Neurosci. 2008 Mar.

Abstract

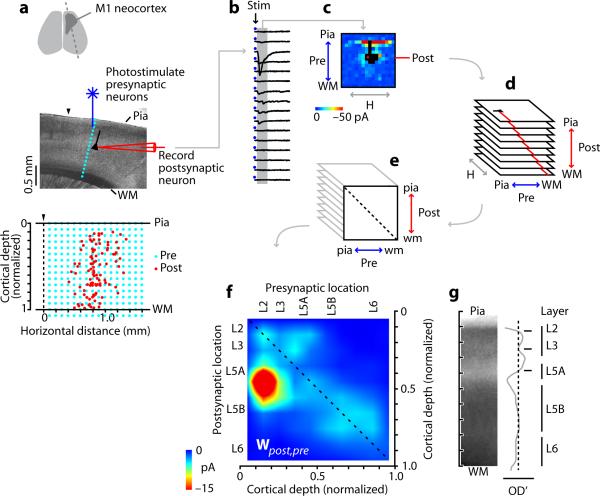
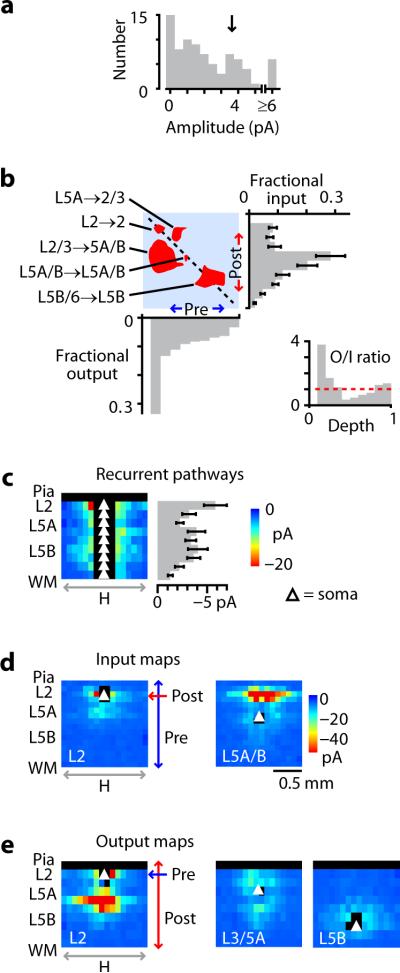
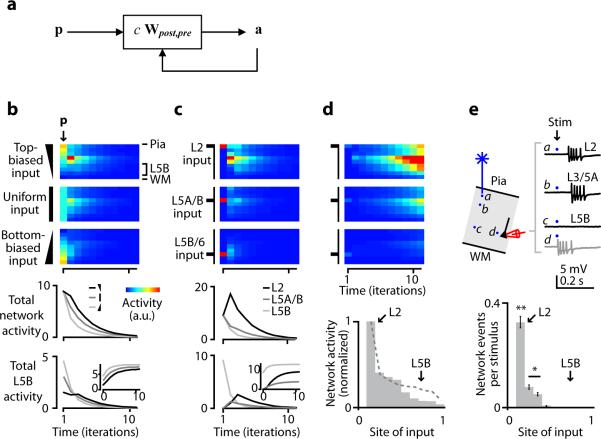
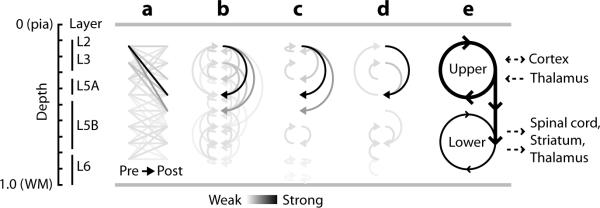
Cortical layering is a hallmark of the mammalian neocortex and a major determinant of local synaptic circuit organization in sensory systems. In motor cortex, the laminar organization of cortical circuits has not been resolved, although their input-output operations are crucial for motor control. Here, we developed a general approach for estimating layer-specific connectivity in cortical circuits and applied it to mouse motor cortex. From these data we computed a laminar presynaptic --> postsynaptic connectivity matrix, W(post,pre), revealing a complement of stereotypic pathways dominated by layer 2 outflow to deeper layers. Network modeling predicted, and experiments with disinhibited slices confirmed, that stimuli targeting upper, but not lower, cortical layers effectively evoked network-wide events. Thus, in motor cortex, descending excitation from a preamplifier-like network of upper-layer neurons drives output neurons in lower layers. Our analysis provides a quantitative wiring-diagram framework for further investigation of the excitatory networks mediating cortical mechanisms of motor control.


Figures

Figure 1
Figure 1
Experimental approach. a, Slice preparation and recording arrangement. Dashed line (top), slice orientation; (▼), posterior border of M1. Bottom plot: locations of the recorded (postsynaptic) neurons (red), and of the (presynaptic) stimulation sites in the mapping grid (blue), which for each neuron was centered horizontally over the soma. b, Traces from one column of stimulation (Stim) sites. c, One neuron's synaptic input map. Black pixels: traces excluded due to direct dendritic stimulation. d, Maps from all postsynaptic neurons were sorted by postsynaptic laminar location, and binned and averaged. e, Maps in d were projected onto a single plane by averaging along map rows; i.e., collapsing the horizontal (H) dimension. f, The resulting map (interpolated for display) is a laminar connectivity matrix, Wpost,pre, representing presynaptic→postsynaptic pathway strengths. Intralaminar pathways are on the main diagonal (dashed line). Color scale compressed by ~50% to show weaker pathways. g, Average of 15 brightfield images of M1, showing cortical lamination pattern. OD', first derivative of image intensity (relative optical density); zero crossings correspond approximately to layers as labeled.
Figure 2
Figure 2
Synaptic input and output in the local circuit. a, Distribution of pathway strengths, showing peak at intermediate values (arrow). b, Binarized version of the connectivity matrix, thresholded (at arrow in a) to illustrate major pathways (red areas), with plots showing input (right; error bars: s.e.m.), output (bottom), and ratio of output to input (inset) as a function of cortical depth. Horizontal dashed line in inset indicates ratio of 1. Fractional input and output were calculated by summing along rows and columns, respectively, and normalizing by the overall total. c, Recurrent pathways. Each row in the image corresponds to data in the original averaged input maps indexed by level as indicated by the red lines in Fig. 1d. Error bars: s.e.m. d, Input maps, corresponding to rows in Wpost,pre, for L2 neurons (left) and L5A/B neurons (right). e, Output maps, corresponding to columns in Wpost,pre, for L2 (left), L3/5A (center), and lower L5B (right) neurons. See Fig. 2d for color scale.
Figure 3
Figure 3
Network activity in simulated circuits and disinhibited slices. a, Network model. b, Flow of excitatory activity in the network model. Images show simulated network activity over time, for biased patterns of input (p) as indicated. Plots show instantaneous activity summed over all layers (upper plot) or only L5B (lower plot; inset, cumulative plot of same data). c, Flow of excitatory activity in the network model for inputs targeted to different layers. d, Network model as in b, but scaled to induce runaway excitation. Lower plot shows network activity as a function of laminar level of input. For comparison, total output per layer is also plotted (dashed line, data from summed output plot in Fig. 2b). e, Network-wide events were evoked by photostimulation under conditions of mild disinhibition (1 μM SR95531) and recorded in L5B neurons at a variety of horizontal locations in M1. Schematic illustrates recording arrangement. Traces show epileptiform events induced by photostimulation in different layers, recorded from a L5B neuron in cell-attached mode. Direct local stimulation of the neuron caused local short latency events (gray trace). Upper-layer stimulation evoked longer latency network-wide events (black traces). Plot shows average probability (± s.e.m.) of evoking network events as a function of laminar level of input. The likelihood of a stimulus evoking an event was greatest for L2 stimuli (**, P < 0.01 compared to deeper layers), intermediate for other upper-layer stimuli (*, P < 0.05 compared to deeper layers), and at or near zero for lower-layer stimuli.
Figure 4
Figure 4
Wiring diagrams. a, Quantitative representation of the strongest 95% of pathways in Wpost,pre. Matrix values were used to color-code lines connecting presynaptic locations (left) to postsynaptic locations (right). b, Same data, but with matrix values color-coded as arrows; ascending pathways are on the left, descending pathways on the right, and horizontal pathways are shown as small arrows on both sides. c, Wiring diagram showing only the strongest input pathways for each postsynaptic layer (Wpost,pre row maxima). d, Wiring diagram showing only the strongest output pathways for each presynaptic layer (Wpost,pre column maxima). e, Qualitative interpretation. Strong L2 outflow drives both a strong upper loop and a weak lower loop. In M1, corticocortical and thalamocortical inputs target upper layers, and corticospinal and corticothalamic outputs arise primarily from lower layers.

Similar articles

Cited by

References

    1. Wise SP, Donoghue JP. Cerebral cortex. In: Jones EG, Peters A, editors. Sensory-motor areas and aspects of cortical connectivity. Plenum; New York: 1986. pp. 243–270.
    1. Keller A. Intrinsic synaptic organization of the motor cortex. Cereb Cortex. 1993;3:430–41. - PubMed
    1. Schieber MH. Constraints on somatotopic organization in the primary motor cortex. J Neurophysiol. 2001;86:2125–43. - PubMed
    1. Callaway EM. Local circuits in primary visual cortex of the macaque monkey. Annu Rev Neurosci. 1998;21:47–74. - PubMed
    1. Douglas RJ, Martin KA. Neuronal circuits of the neocortex. Annu Rev Neurosci. 2004;27:419–51. - PubMed

Publication types

MeSH terms

LinkOut - more resources