Comparative Study
. 2008 Feb;123(2):973-85.
doi: 10.1121/1.2821986.

Behavioral and physiological correlates of temporal pitch perception in electric and acoustic hearing

Affiliations
Comparative Study

Behavioral and physiological correlates of temporal pitch perception in electric and acoustic hearing

Robert P Carlyon et al. J Acoust Soc Am. 2008 Feb.

Abstract

In the "4-6" condition of experiment 1, normal-hearing (NH) listeners compared the pitch of a bandpass-filtered pulse train, whose inter-pulse intervals (IPIs) alternated between 4 and 6 ms, to that of isochronous pulse trains. Consistent with previous results obtained at a lower signal level, the pitch of the 4-6 stimulus corresponded to that of an isochronous pulse train having a period of 5.7 ms-longer than the mean IPI of 5 ms. In other conditions the IPI alternated between 3.5-5.5 and 4.5-6.5 ms. Experiment 2 was similar but presented electric pulse trains to one channel of a cochlear implant. In both cases, as overall IPI increased, the pitch of the alternating-interval stimulus approached that of an isochronous train having a period equal to the mean IPI. Experiment 3 measured compound action potentials (CAPs) to alternating-interval stimuli in guinea pigs and in NH listeners. The CAPs to pulses occurring after 4-ms intervals were smaller than responses to pulses occurring after 6-ms intervals, resulting in a modulated pattern that was independent of overall level. The results are compared to the predictions of a simple model incorporating auditory-nerve (AN) refractoriness, and where pitch is estimated from first-order intervals in the AN response.


Figures
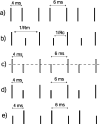
Fig 1
Fig 1
Solid bars show schematic illustrations of some of the stimuli used in this and other studies. Only the first seven pulses in each train are shown. The open bars in part c) illustrate a possible pattern of CAP responses Further details are given in the text.
Fig 2
Fig 2
Psychometric functions showing the percentage of trials in which the isochronous comparison sound, whose period is given on the abscissa, was judged higher than 3.5-5.5 (diamonds), 4-6 (squares), and 4.5-6.5 (triangles) standard stimuli. Data are averaged across the NH listeners of experiment 1.
Fig 3
Fig 3
Part a) shows the Point of Subjective Equality (“PSE”) derived from the psychometric functions of experiment 1, for 7 NH listeners. The ordinate shows the mean interval in each of the three standard sounds tested. Mean data are shown by the heavy dashed line joining squares. The prediction of Carlyon et al (2002)'s model is shown by the heavy dashed line joining “plus” signs. These two heavy curves overlap, testifying to the success of the model. Part b) shows the same data, with the PSEs divided by the mean interval in each standard. In both parts of the fig., predictions based on the recovery function described by Fitzpatrick et al (1999) are shown by filled circles.
Fig 4
Fig 4
As Fig. 3, except for the five CI listeners of experiment 2.
Fig 5
Fig 5
Part a) shows the CAP to a single pulse from one GP of experiment 3a. Part b) shows the response to a 78-dB-SPL 4-6 pulse train in the same animal. The area shown by the dashed box is expanded and illustrated in part c).
Fig 6
Fig 6
Part a): Lines connecting symbols show the ratio of CAP amplitudes after 6- vs. 4-ms intervals in a 4-6 pulse train, for each GP of experiment 3a, as a function of stimulus level. The heavy line without symbols shows the mean data. Parts b) and c) illustrate the level-independence of the AN response by plotting the CAP waveform for GP2 at levels of 88 and 38 dB SPL, respectively.
Fig 7
Fig 7
Part a) shows the CAP to a stimulus consisting of the first pulse of a 4-6 pulse train, in listener NH2. Part b) shows the response to part of a 4-6 pulse train in listener NH7. Part c) shows a zoomed-in portion of part b). The vertical gridlines are spaced, alternately, by 4 and 6 ms.
Fig 8
Fig 8
The squares show the recovery function, expressed as response amplitude re that at IPI=3.5 ms, necessary for the neural model to account for the NH pitch data from experiment 1. The solid line passing through these points represents the best fit to these data using a logarithmic function (see text for details). The triangles show the points derived from the GP data of experiment 3b: the ratio between the amplitudes at 5.5 vs 3.5, 6 vs 4, and 6.5 vs 4.5 ms reflect the depth of AM in the CAP response to the 3.5-5.5, 4-6, and 4.5-6.5 stimuli respectively. The vertical distances between other delays (e.g. 3.5 vs 4 ms) were adjusted to provide the best logarithmic fit to the data, shown by the bold solid line. The ratio between these first two curves (faint and bold solid lines) is shown by the dot-dashed line. The bold dashed line shows the two-pulse recovery functions for the cat AN described by Fitzpatrick et al (1999), as fit by Carlyon et al (2002). The dotted line shows the CAP amplitude to the second pulse in each train as a proportion of that to the first, using data obtained from experiment 3b.

References

    1. Cariani PA, Delgutte B. Neural correlates of the pitch of complex tones. I. Pitch and pitch salience. J. Neurophysiol. 1996;76:1698–1716. - PubMed
    1. Carlyon RP. The effects of two temporal cues on pitch judgements. J. Acoust. Soc. Am. 1997;102:1097–1105.
    1. Carlyon RP. Temporal pitch mechanisms in acoustic and electric hearing. J. Acoust. Soc. Am. 2002;112:621–633. - PubMed
    1. Carlyon RP, Shamma S. An account of monaural phase sensitivity. J. Acoust. Soc. Am. 2003;114:333–348. - PubMed
    1. Carlyon RP, van Wieringen A, Long CJ, Deeks JM, Wouters J. Temporal pitch mechanisms in acoustic and electric hearing. J. Acoust. Soc. Am. 2002;112:621–633. - PubMed

Publication types