Comparative Study
. 2008 Feb;4(2):e14.
doi: 10.1371/journal.pgen.0040014.

Network discovery pipeline elucidates conserved time-of-day-specific cis-regulatory modules

Affiliations
Comparative Study

Network discovery pipeline elucidates conserved time-of-day-specific cis-regulatory modules

Todd P Michael et al. PLoS Genet. 2008 Feb.

Abstract

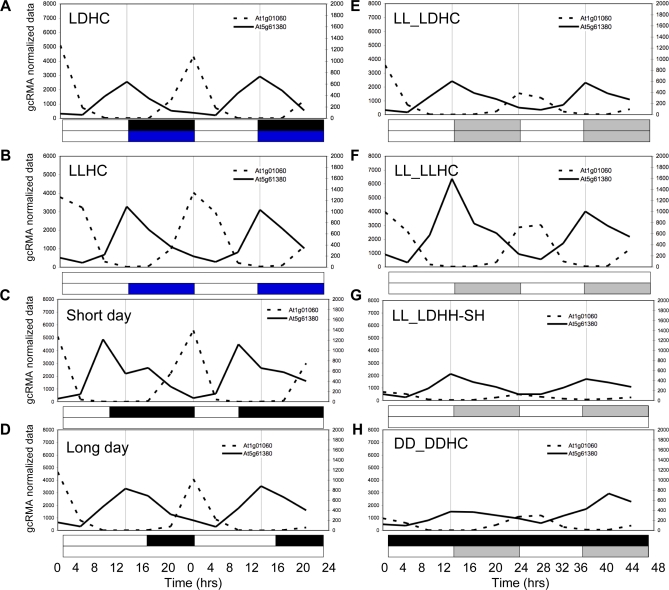
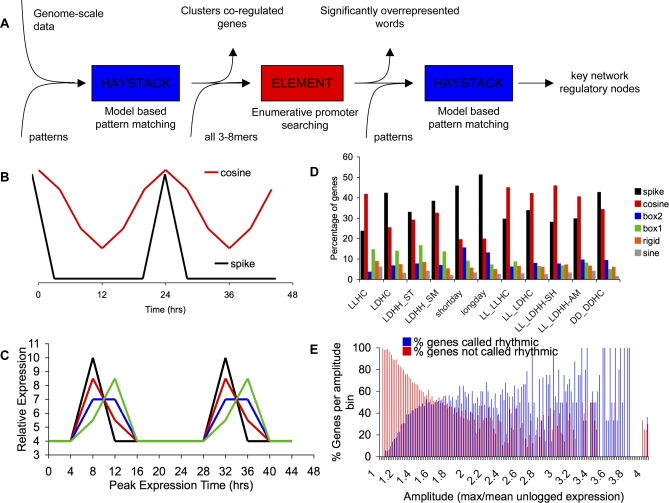
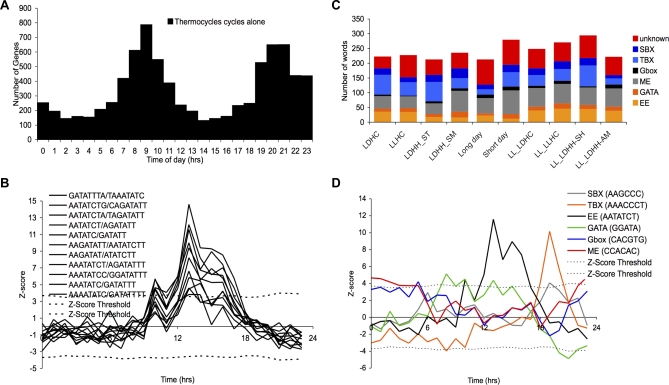
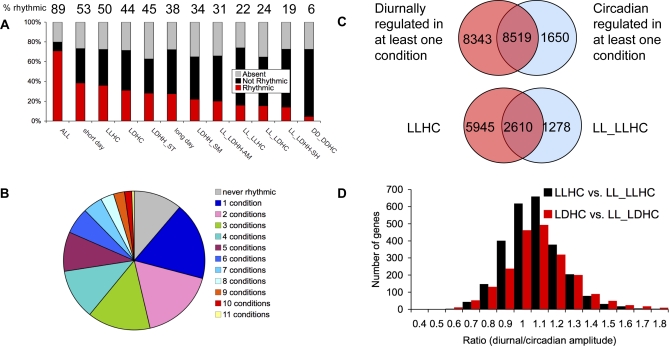
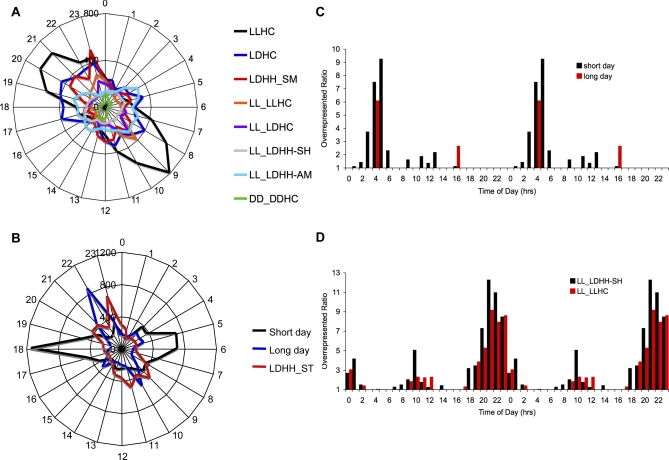
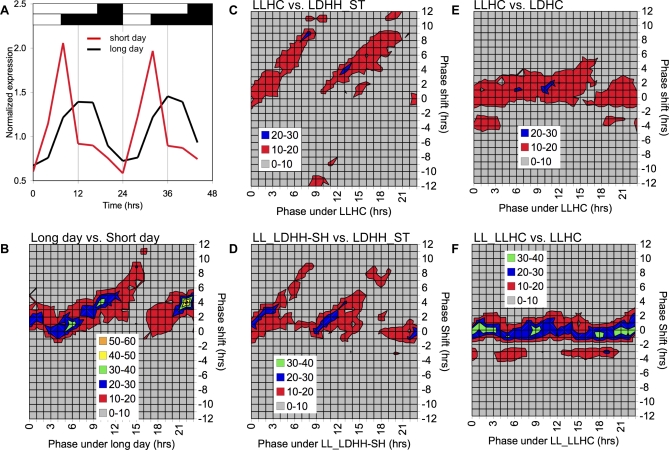
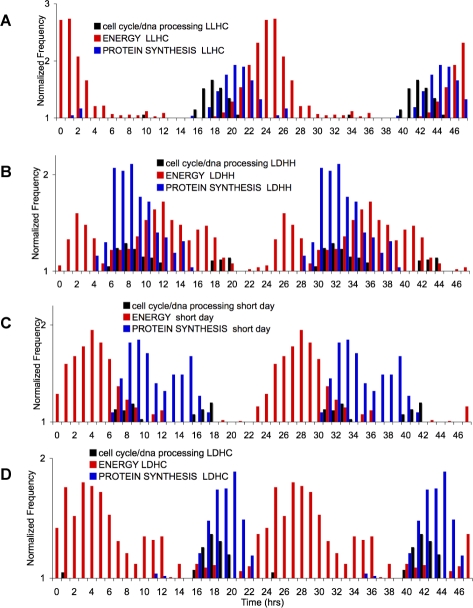
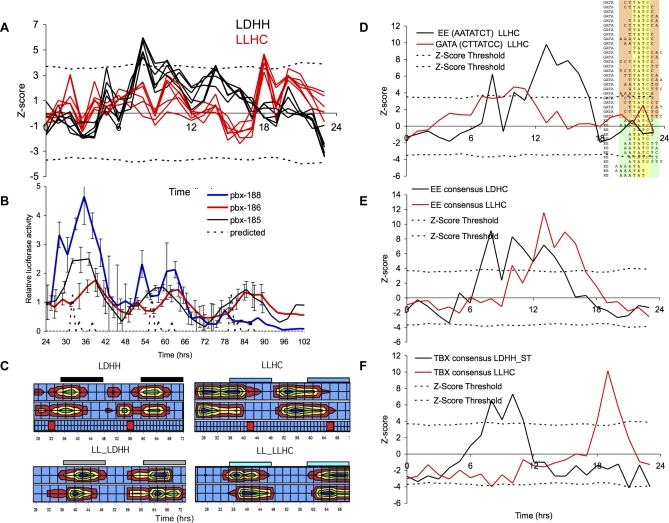
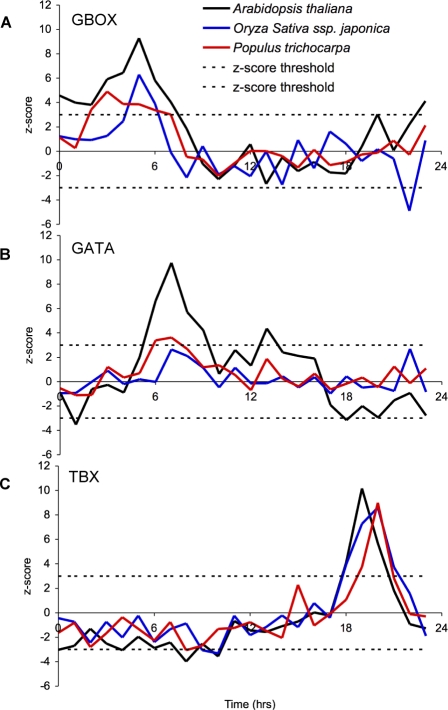
Correct daily phasing of transcription confers an adaptive advantage to almost all organisms, including higher plants. In this study, we describe a hypothesis-driven network discovery pipeline that identifies biologically relevant patterns in genome-scale data. To demonstrate its utility, we analyzed a comprehensive matrix of time courses interrogating the nuclear transcriptome of Arabidopsis thaliana plants grown under different thermocycles, photocycles, and circadian conditions. We show that 89% of Arabidopsis transcripts cycle in at least one condition and that most genes have peak expression at a particular time of day, which shifts depending on the environment. Thermocycles alone can drive at least half of all transcripts critical for synchronizing internal processes such as cell cycle and protein synthesis. We identified at least three distinct transcription modules controlling phase-specific expression, including a new midnight specific module, PBX/TBX/SBX. We validated the network discovery pipeline, as well as the midnight specific module, by demonstrating that the PBX element was sufficient to drive diurnal and circadian condition-dependent expression. Moreover, we show that the three transcription modules are conserved across Arabidopsis, poplar, and rice. These results confirm the complex interplay between thermocycles, photocycles, and the circadian clock on the daily transcription program, and provide a comprehensive view of the conserved genomic targets for a transcriptional network key to successful adaptation.


Conflict of interest statement

Competing interests. The authors have declared that no competing interests exist.

Figures

Figure 1
Figure 1. LHY (At1g01060) and TOC1 (At5g61380) Cycle as Expected across Diurnal and Circadian Time Courses
Unlogged gcRMA normalized time course data are plotted as a function of time in hours. Light and temperature conditions are indicated below the data. In the diurnal conditions (A–D), the upper condition box represents photocycles; the black boxes indicate the dark period. The lower condition box represents thermocycles with blue boxes indicating 12 °C and the open boxes 22 °C. Specifics for each condition are outlined in Table 1 and Figure S3. Grey boxes represent subjective night or cold temperatures under circadian conditions. (A) LDHC, (B) LLHC, (C) Long day, (D) Short day, (E) LL_LDHC, (F) LL_LLHC, (G) LL_LDHH, and (H) DD_DDHC.
Figure 2
Figure 2. The Network Discovery Pipeline Identifies Patterns in Large Datasets
(A) Data flow of the network discovery pipeline. (B) Models used to identify diurnal and circadian regulated transcripts: Spike and Cosine. (C) Models shifted by 1-h increments to quantify time-of-transcript abundance. All models were shifted in 1-h increments, causing a change in the model form and shape over the day to account for changing waveforms caused by our 4-h sampling strategy. The models are presented in batches covering 4-h time intervals for presentation purposes: the spike model shifted to Zeitgeber Time 08 (ZT08, 8 h after dawn, black line), ZT09 (red line), ZT10 (blue line), and ZT11 (green line). (D) Model usage broken down by percent of genes called rhythmic by each model. Spike (black), cosine (red), box2 (blue), box1 (green), rigid (orange), and sine (grey) models were used to identify cycling transcripts. The model with the highest correlation was retained and then used to predict cycling if it had a significant correlation (r ∼ 0.8, FDR ≤ 5.8%). (E) Comparison of percent of genes called rhythmic versus genes not called rhythmic by amplitude. Amplitude was estimated by dividing the maximum by the mean expression value across the time course. Genes were then plotted as the percentage that have specific amplitude and are either rhythmic (blue) or arrhythmic (red).
Figure 3
Figure 3. Diurnal and Circadian cis-Elements Identified over the Day
(A) Frequency distribution of the number of cycling genes per phase bin under thermocycles alone. (B) z-Score profiles of overrepresented 3–8mer words composing the evening element (EE: AATATCT). z-Score threshold (dotted line) and z-score profiles (solid black lines) for words found in the EE. LLHC condition. (C) Number of words identified by condition. Unknown words (red), SBX, and TBX (shade of blue), Gbox/ME (shade of black), and EE/GATA (shade of orange). LLHC condition. (D) z-Score profiles of summarized words cover the entire day. SBX (grey), TBX (orange), EE (black), GATA (green), Gbox (blue), ME (red). LLHC condition.
Figure 4
Figure 4. 89% of the Arabidopsis Transcriptome Is Controlled by Thermocycles, Photocycles, or the Circadian Clock
(A) Percentage of genes called rhythmic per condition. Grey bar represents the percentage of genes removed because they were called absent at more than nine time points over the twelve-time point time course. Red bars represent percentage of genes called rhythmic (r > 0.8; FDR ≤ 5.8%) using the model-based pattern-matching algorithm (HAYSTACK). Black bar represents the remaining genes that are not rhythmic (r < 0.8; FDR > 5.8%). % Rhythmic reflects the percentage of genes called rhythmic after exclusion of genes called absent. “ALL” represents genes that cycle in at least one of the eleven conditions. (B) Breakdown of percentage of genes that cycle per condition from “ALL” in (A). Genes that are never rhythmic represent 11% of the total genes that were called present in at least nine of twelve time points. The remaining 89% of genes were broken down by the number of conditions for which they were called cycling. For example, one condition means a gene only cycled under one of eleven conditions. (C) Circadian-regulated genes are a subset of diurnally regulated genes. Number of genes that overlap between genes called rhythmic under at least one diurnal condition (16,862) and genes called rhythmic under at least one circadian condition (10,169). Overlap between genes called rhythmic under LLHC compared to LL_LLHC. (D) Ratio of diurnal amplitude versus circadian amplitude. Amplitude was calculated as maximum unlogged gcRMA expression divided by the mean expression across the time course for a specific gene. Only genes that were rhythmic under both conditions were used in this analysis. LLHC versus LL_LLHC (black) and LDHC versus LL_LDHC (red).
Figure 5
Figure 5. Transcripts Are Phased to Dawn and Dusk
(A) Number of genes per phase under LLHC (black), LDHC (blue), LDHH_SM (grey), LL_LLHC (orange), LL_LDHC (purple), LL_LDHH-SH (grey), LL_LDHH-AM (light blue), and DD_DDHC (green). Radial plots with phase (h) on the circumference and number of genes on the radius. (B) Number of genes per phase under short day (black) and long day (blue) compared to LDHH_ST (red). (C) Phase overrepresentation plot comparing the phase under short day (black) and long day (red) of the 383 transcripts identified with the 2peak model under long days. Phase overrepresentation plots are generated by dividing the number of genes with a specific phase by the ratio of genes observed with that phase. [Number of genes in the list with phase X / (observed number of genes with phase X/total number of genes)]. (D) Phase overrepresentation plot comparing the phase under LL_LDHH-SH (black) and LL_LLHC (red) of the 383 transcripts identified with the 2peak model under long day.
Figure 6
Figure 6. Thermocycles and Photocycles Have Distinct Phase Relationships
(A) Long day photocycles (16 h light/8 h dark) phase delay genes compared to short day photocycles (8 h light/16 h dark). Expression pattern is the average of 23 genes displaying a 6-h phase delay between long day (black, phase 13 h), and short day (red, phase 7 h). (B) Long day photocycles globally phase delay genes as compared to short day photocycles. Phase shift topology graph plots percent of genes phase shifted per phase bin (y-axis) by the reference condition phase (x-axis). Only genes that are rhythmic between both conditions are used in this analysis. Percent of genes was calculated as the number of genes with a given phase shift per phase divided by the total number of genes with that phase. A positive phase shift reflects a later phase than the reference condition, and a negative phase shift reflects an earlier phase than the reference condition. Long day photocycle is the reference condition and consistent with (A), long day photocycles delay the phase (positive phase shift). (C) Phase-shift topology between LLHC and LDHH_ST, where LLHC is the reference phase. (D) Phase-shift topology between LL_LLHH-SH and LDHH_ST, where LL_LDHH-SH is the reference phase. (E) Phase-shift topology between LLHC and LDHC, where LLHC is the reference phase. (F) Phase-shift topology between LL_LLHC and LLHC, where LL_LLHC is the reference phase.
Figure 7
Figure 7. Thermocycles Phase Protein Synthesis to Midnight
(A–D) Protein synthesis genes are overrepresented at distinct times of day under thermocycles and photocycles. Three consecutive phases were merged and used as the input genes list per phase. The data are double plotted (one day of data displayed as two days) for visualization purposes. Cell cycle/DNA processing (black), protein synthesis (red), and energy (blue) genes plotted as normalized frequency. Normalized Frequency is calculated as follows: Number_in_Classinput_set/Number_Classifiedinput_set)/(Number_in_Classreference_set (ATH1)/ Number_Classifiedreference_set). Gene Ontology overrepresentation maps were made using the Classification SuperViewer Tool at Botany Array Resource (http://bbc.botany.utoronto.ca/). (A) LLHC; (B) LDHH-ST; (C) short day; (D) LDHC.
Figure 8
Figure 8. The PBX/TBX/SBX cis-Regulatory Module Controls Condition Specific Diurnal and Circadian Transcription
(A) z-Score profiles of words that make up the PBX (ATGGGCC) under LDHH (black) and LLHC (red). (B) 3xPBX::LUC cycles under LDHH. Four to six seedlings from several independent T2 lines were analyzed and averaged. Results from three independent experiments are shown (Experiment number 185 n = 10, 186 n = 4, and 188 n = 3). (C) PBX cycles under all diurnal and circadian conditions tested. Heat map displaying the phase of the 3xPBX::LUC lines from two independent experiments under four different experimental conditions, LDHH (black bar, dark), LLHC (blue bar, cold), LL_LDHH (grey bar, subjective night), and LL_LLHC (light blue bar, subjective night). The predicted phase for LDHH and LLHC is displayed below heat maps (red square). Heat map from high relative expression to low (purple, green, yellow, red, and blue). (D) EE (black) and GATA (red) z-score profiles have distinct phases of overrepresentation, and share the GATA core but differ at flanking sequence. (E) z-Score profile of the consensus EE shifts phase between LDHC (black) and LLHC (red). (F) z-Score profile of the consensus TBX shifts phase between LDHH_ST (black) and LLHC (red).
Figure 9
Figure 9. The Three cis-Regulatory Modules Are Conserved across Species
z-Score profiles of cis-regulatory modules in Arabidopsis thaliana (black), Oryza sativa ssp. japonica (rice, blue), and Populus trichocarpa (poplar, red). z-Score threshold (dotted line). (A) z-Score profile of the Gbox (CACGTG). (B) z-Score profile of the GATA (GATA). (C) z-Score profile of the TBX (AAACCCT).

Similar articles

Cited by

References

    1. Michael TP, Salome PA, Yu HJ, Spencer TR, Sharp EL, et al. Enhanced fitness conferred by naturally occurring variation in the circadian clock. Science. 2003;302:1049–1053. - PubMed
    1. Dodd AN, Salathia N, Hall A, Kevei E, Toth R, et al. Plant circadian clocks increase photosynthesis, growth, survival, and competitive advantage. Science. 2005;309:630–633. - PubMed
    1. Woelfle M, Ouyang Y, Phanvijhitsiri K, Johnson C. The adaptive value of circadian clocks: an experimental assessment in cyanobacteria. Curr Biol. 2004;14:1481–1486. - PubMed
    1. Wijnen H, Young M. Interplay of circadian clocks and metabolic rhythms. Annu Rev Genet. 2006;40:409–448. - PubMed
    1. Lahiri K, Vallone D, Gondi SB, Santoriello C, Dickmeis T, et al. Temperature regulates transcription in the zebrafish circadian clock. PLoS Biol. 2005;3:e351. doi: 10.1371/journal.pbio.0030351. - DOI - PMC - PubMed

Publication types

MeSH terms