. 2008 May;105(3):628-40.
doi: 10.1111/j.1471-4159.2007.05177.x. Epub 2008 Jan 28.

Aquaporin 1 - a novel player in spinal cord injury

Affiliations

Aquaporin 1 - a novel player in spinal cord injury

O Nesic et al. J Neurochem. 2008 May.

Abstract

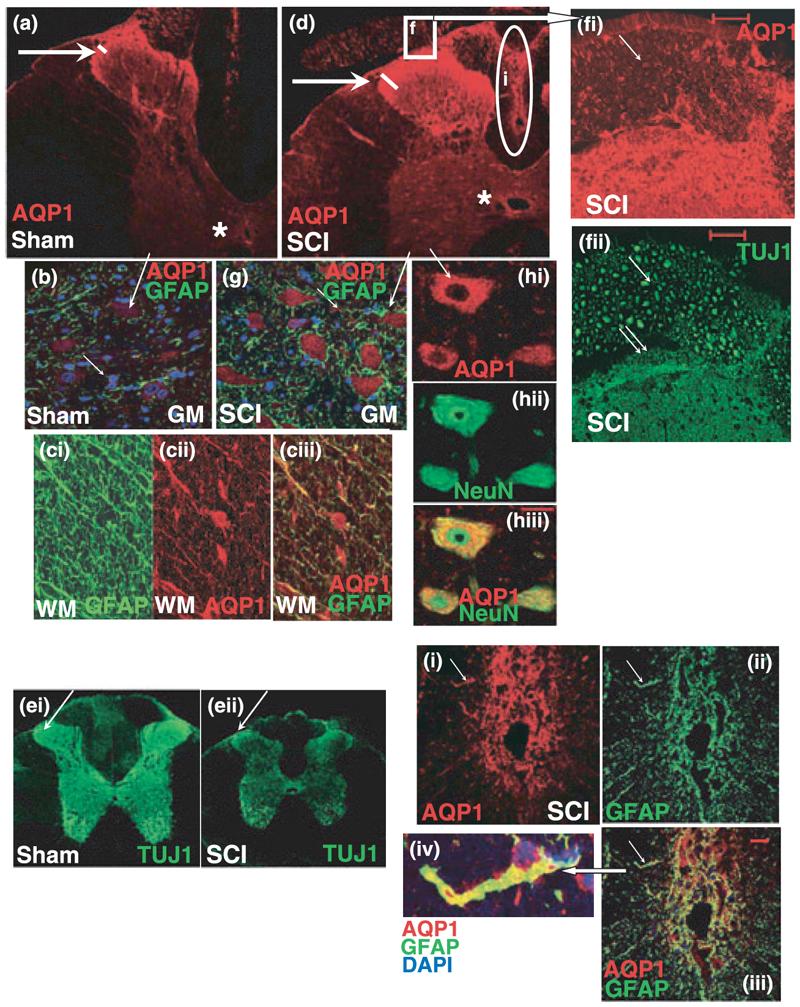
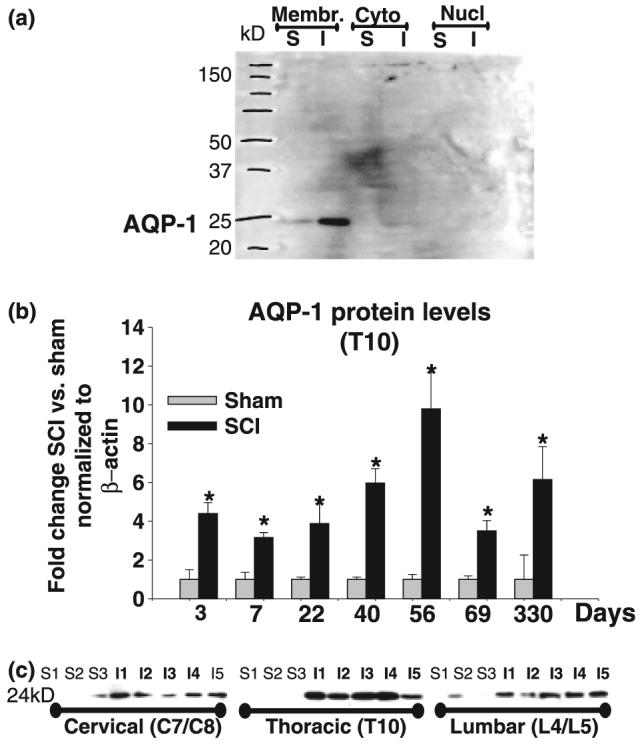
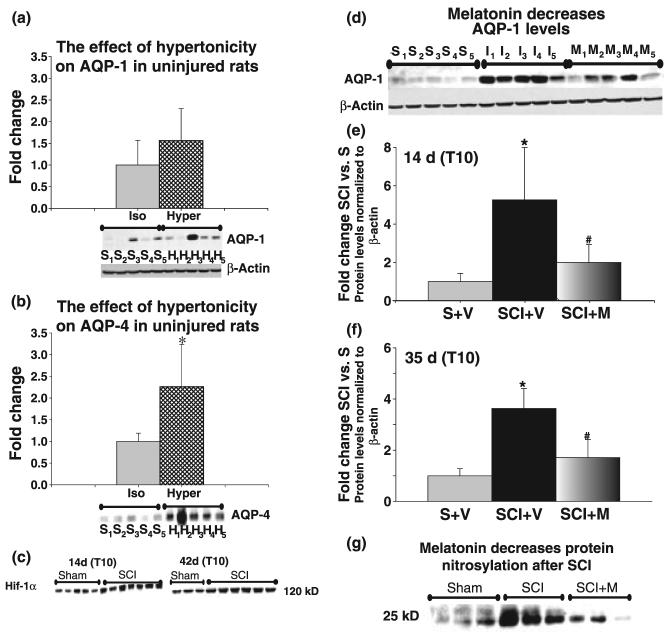
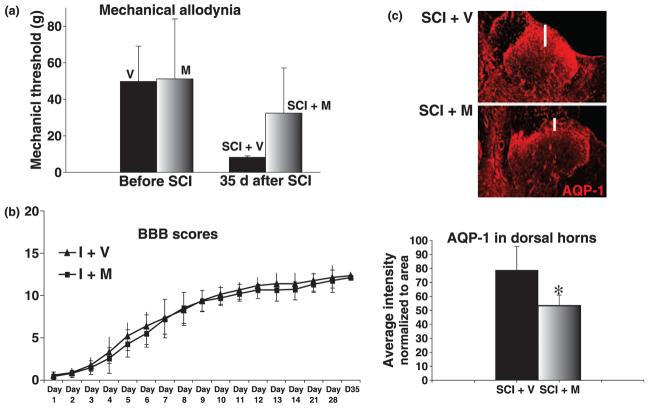
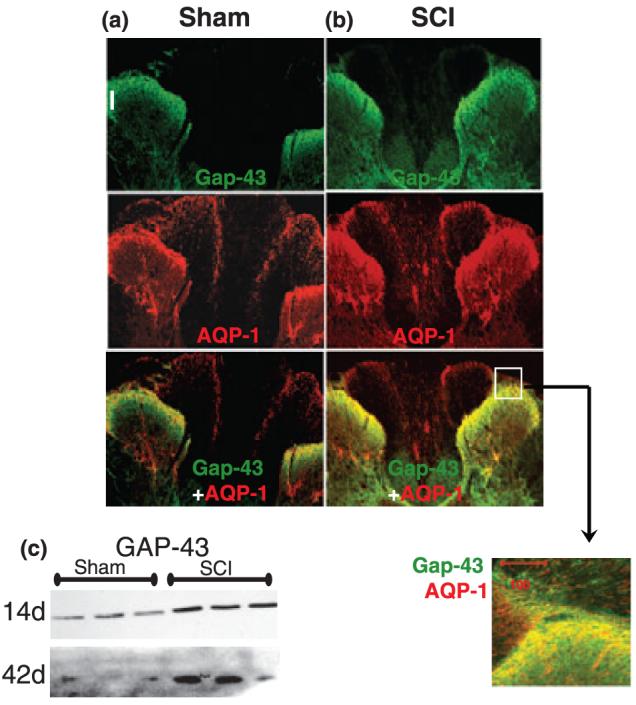
The role of water channel aquaporin 1 (AQP-1) in uninjured or injured spinal cords is unknown. AQP-1 is weakly expressed in neurons and gray matter astrocytes, and more so in white matter astrocytes in uninjured spinal cords, a novel finding. As reported before, AQP-1 is also present in ependymal cells, but most abundantly in small diameter sensory fibers of the dorsal horn. Rat contusion spinal cord injury (SCI) induced persistent and significant four- to eightfold increases in AQP-1 levels at the site of injury (T10) persisting up to 11 months post-contusion, a novel finding. Delayed AQP-1 increases were also found in cervical and lumbar segments, suggesting the spreading of AQP-1 changes over time after SCI. Given that the antioxidant melatonin significantly decreased SCI-induced AQP-1 increases and that hypoxia inducible factor-1alpha was increased in acutely and chronically injured spinal cords, we propose that chronic hypoxia contributes to persistent AQP-1 increases after SCI. Interestingly; AQP-1 levels were not affected by long-lasting hypertonicity that significantly increased astrocytic AQP-4, suggesting that the primary role of AQP-1 is not regulating isotonicity in spinal cords. Based on our results we propose possible novel roles for AQP-1 in the injured spinal cords: (i) in neuronal and astrocytic swelling, as AQP-1 was increased in all surviving neurons and reactive astrocytes after SCI and (ii) in the development of the neuropathic pain after SCI. We have shown that decreased AQP-1 in melatonin-treated SCI rats correlated with decreased AQP-1 immunolabeling in the dorsal horns sensory afferents, and with significantly decreased mechanical allodynia, suggesting a possible link between AQP-1 and chronic neuropathic pain after SCI.


Figures

Fig. 1
Fig. 1
Cellular localization of AQP-1 in uninjured and injured spinal cords. (a) AQP-1 (red) expression in sham spinal cords in T9; 5 months after sham treatment. AQP-1 was primarily expressed in Laminae I and II of uninjured dorsal horns (arrow), but also in ependymal cells lining the central canal (star). (b) AQP-1 (red) was weakly expressed in neuronal cell bodies in uninjured spinal cords, here depicted in motoneuronal somata in the ventral horn of the sham-treated rats presented in (a) (long arrow). Neuronal cell bodies surrounded with GFAP-positive astrocytes (green) were clearly visible. GFAP-labeled astrocytes in the gray mater (GM) also expressed low levels of AQP-1 (marked with the small arrow). (c) GFAP-positive white matter (WM) astrocytes (ci) expressed AQP-1(cii) in cell bodies and processes. Those AQP-1-expressing cell bodies were not identified with CC-1 marker that labels oligodendrocytic somata, so it is likely that AQP-1 is expressed in astrocytic cell bodies in the white matter. Somatic expression of AQP-1 was not observed in gray matter astrocytes. Co-labeing of AQP1 and GFAP was visible in astrocytic processes (ciii). (d) SCI induced increased labeling of AQP-1 in sensory fibers (arrow) and ependymal cells (star; T9 segment 5 months after SCI). AQP-1 positive sensory fibers (arrow) enter dorsal horns via dorsal roots (marked with the square f). Calibration bar: 100 μm. (e) TUJ1 positive axons (green) in uninjured (sham; ei) and injured spinal cords (T9; 5 months after SCI; eii). TUJ-1 labeling markedly decreased in chronically injured spinal cords (SCI), because of the loss of axons throughout spinal cords, including dorsal horn sensory fibers (arrow). Note the shrinkage of chronically injured spinal cords and significant decrease in the overall size of the T9 segment, partly because of the reduced number of axons. (f) AQP-1 expression (red; fi) in TUJ-positive fibers (green; fii) in dorsal root and dorsal horn (spinal cord segment labeled with the square in injured spinal cord, Fig. 1d). Large-diameter fibers expressed low levels of AQP-1 (arrow), in contrast to the small-diameter fibers (<5 μm; double arrow), that expressed significantly higher levels of AQP-1 (calibration bar: 50 μm). (g) Motoneuronal cell bodies expressed visibly more AQP-1 (red) in chronically injured spinal cords (5 months after SCI in T9) than in corresponding sham samples (Fig. 1b). Calibration bar: 50 μm. (h) Neuronal expression of AQP-1 (red) was confirmed using the neuronal-specific marker NueN that selectively stains neuronal nuclei and cell bodies (green). Calibration bar: 25 μm. (i) Hypertrophic, reactive GFAP-positive astrocytes (green, ii) that formed SCI-induced scar in the dorsal column (marked with oval in Fig. 1d) expressed the highest AQP-1 levels (red; i) versus all other astrocytes. Calibration bar: 25 μm. A magnified astrocyte (iv; marked with arrows) was co-labeled with GFAP (green), AQP-1(red), and DAPI (blue), and showed high expression levels of AQP-1 in both the cell body and processes.
Fig. 2
Fig. 2
AQP-1 western blots. (a) AQP-1 western blot analysis of different subcellular compartments. AQP-1 western blot obtained using polyclonal anti-AQP-1 Ab showed only one band of ∼24 kDa. Here, we show representative AQP-1 western blot analysis in different subcellular compartments: membrane-enriched fraction (Membr); cytoplasmic (Cyto), and nuclear (Nucl). We analyzed one sham (S) and one SCI sample (I), obtained by pooling three segments: T9, T10 (site of injury) and T11, 35 days after sham treatment or SCI. The AQP-1 band appeared only in the membrane-enriched fraction, and not in the cytoplasmic or nuclear fractions. The intensity of AQP-1 band was markedly increased in injured spinal cord. (b) Time course of AQP-1expression changes after SCI. Quantitative analyses of immunoblotted AQP-1 expression (western blots) in uninjured and injured spinal cords (at the site of injury, T10) at different time points after SCI: 3 days (n = 3 for sham; n = 4 for SCI and n = 2 for naïve; not shown), 7 days (n = 4 for sham, n = 5 for SCI and n = 4 for naïve, not shown); 22 days (n = 4 for both sham and SCI); 40 days (n = 3 for sham and n = 7 for SCI); 56 days (n = 6 for sham and n = 4 for SCI); and 69 days (n = 5 for sham, n = 5 for SCI and n = 2 naïve; not shown); presented as equidistant time points on the X-axis. The Y-axis represents the relative intensity of the 24 kDa AQP-4 band normalized to β-actin, and then to sham values (set to 1). AQP-1 protein levels showed significant and chronic up-regulation in months after SCI (Bonferroni multiple comparisons tests; *p < 0.05). (c) SCI-induced AQP-1 changes in cervical and lumbar segments. Representative AQP-1 western blots showing the AQP-1 band (∼24 kDa) in three sham samples (S1–S3) and five SCI samples (I1–I5) 69 days after SCI in three spinal regions: cervical (pooled C7 and C8); site of injury (T10) and lumbar (pooled L4 and L5).
Fig. 3
Fig. 3
Melatonin, but not hypertonicity affects AQP-1 expression. (a) Effect of hypertonicity on AQP-1 in uninjured rats. Two groups of sham-treated rats (n = 5 per group) were implanted with intrathecal catheters connected to osmotic minipumps. One group received isotonic solution (0.9% NaCl) continuously (2.5 μL/h) over 3 weeks; the other received hypertonic solution (6% NaCl) continuously (2.5 μL/h) over 3 weeks. Spinal cords were extracted after 3 weeks; proteins extracted from T10, and AQP-1 western blots performed. Western blot data are presented below the bar graph. S1–S5: sham rats receiving isotonic solution; H1–H5: sham rats receiving hypertonic solution. Quantitative analysis of the western blot data (bar graphs) showed that hypertonic solution did not significantly increase AQP-1 levels. Only one sample (H3) had higher AQP-1 levels that may have resulted from an accidental injury during intrathecal catheterization, and not from the differences in the sample loading (see β-actin). Because of that outlier, average AQP-1 levels seem higher in rats treated with hypertonic solution, although the difference was not statistically significant. However, AQP-1 levels in all other uninjured samples (n = 4) treated with hypertonic solution were indistinguishable from samples treated with isotonic solution (n = 5). AQP-1 protein levels were first normalized to β-actin (shown below the AQP-1 western blot data). All data were then normalized to AQP-1 levels in sham rats receiving isotonic solution (set to 1). (b) Effect of hypertonicity on AQP-4 in uninjured rats. In the same samples used in (a), we separately measured the protein levels of AQP-4 using western blots (∼30 kDa). All five samples from sham rats treated with hypertonic solution (H1–H5) had higher AQP-4 protein levels than uninjured samples treated with isotonic solution (S1–S5). The bar graph shows a statistically significant increase in AQP-4 protein levels induced by hypertonicity (*p < 0.05). (c) Hif-1α is increased in chronically injured spinal cords. SCI induced significant up-regulation of nuclear Hif-1α at T10, both at 14 and 42 days after SCI. Here, we present Hif-1α western blots of five sham samples and seven SCI samples 14 days after SCI, and three sham samples and six SCI samples 42 days after SCI. (d) The effect of the antioxidant melatonin on AQP-1 expression 14 days after SCI. Representative western blot data showing AQP-1 levels in T10 of: (1) sham-treated rats (n = 5; S1–S5) that received intraperitoneal injections of vehicle daily for 14 days; (2) SCI rats that received vehicle n = 5(I1–I5); and (3) SCI rats that received melatonin (10 mg/kg; n = 5; M1–M5). Rats were killed 2 weeks after SCI, proteins extracted from T10 and AQP-1 western blots performed for AQP-1 and β-actin. (e) Quantitative analysis of western blot data presented as bar graphs show that SCI induced 5.3-fold increases in AQP-1-protein levels 14 days after SCI (*p < 0.05), in agreement with our data presented in Fig. 2. Melatonin treatment significantly reduced AQP-1 levels at day 14 post-contusion by ∼60% (#p < 0.05). (f) The effect of the antioxidant melatonin on AQP-1 expression 35 days after SCI. In a similar experimental paradigm, one group of sham rats (n = 4) was treated with vehicle daily for 35 days, one group of SCI rats was treated with vehicle (n = 5), and one group of SCI rats was treated with melatonin (n = 4) for 35 days. SCI-induced fourfold significant increases in AQP-1 levels in T10, 35 days after SCI were significantly reduced (#p < 0.05) in melatonin treated SCI rats by 41.5%. (g) SCI-induced protein nitrosylation decreases in melatonin-treated SCI rats. Western blot analysis of nitrosylated proteins in nine samples, in the same experimental paradigm described under (d). Here, we present a representative but unidentified protein band of ∼25 kDa in three sham samples (treated with vehicle), three SCI samples (treated with vehicle), and three SCI samples treated with melatonin (SCI + M). The intensity of that band significantly increased in injured spinal cords (T10; 35 days after SCI; p < 0.05), but was significantly decreased (p < 0.01) in melatonin-treated SCI rats.
Fig. 4
Fig. 4
Melatonin decreases pain and AQP-1 in the dorsal horns after SCI. (a) Mechanical allodynia in the trunk region (girdling). We used Von Frey filaments to determine pain threshold values (in grams, presented on Y-axis as average values ± SD). The pain thresholds in all rats before SCI were between 40 and 50 g. Rats were divided into three groups: (1) rats that will be injured, and will receive vehicle (V) via i.p injection for 35 days, (2) rats that will be injured and will receive i.p. melatonin (M) for 35 days, (3) and rats that will undergo sham treatment and will receive i.p. vehicle for 35 days (not shown). The threshold values for sham rats (n = 13) 35 days after sham-treatment were unchanged compared with their baseline values before undergoing sham treatment (not shown). The average threshold for vehicle-treated SCI rats (SCI + V; n = 9) before SCI was 49.78 ± 19 g, but significantly decreased to 8.25 ± 0.7 g 35 days after SCI. However, the average threshold for melatonin-treated SCI rats (SCI + M; n = 10) decreased from 51.15 ± 32.84 before SCI to 32.4 ± 24 g 35 days after SCI. Therefore, melatonin-treated SCI rats have significantly higher pain threshold values than vehicle-treated SCI rats (p = 0.013). (b) Locomotor recovery. BBB scores were measured over a 35 days period in two groups of SCI rats: rats that received vehicle for 35 days (I + V; n = 9) and rats that received melatonin for 35 days (I + M; n = 10). The experimental paradigm used in this experiment is explained in Fig 3d. BBB scores were presented as average values ± SD in both vehicle and melatonin-treated SCI rats, and were undistinguishable. (c) AQP-1 immunolabeling in dorsal horns of T9 segments 35 days after SCI, in two groups of rats: SCI rats that received vehicle for 35 days (SCI + V; n = 3) and SCI rats that received melatonin for 35 days (SCI + M; n = 3). Here we show a representative image of AQP-1 immunoreactivity (IR) in the left panel, and semi-quantitative analysis of AQP-1 IR in the dorsal horns, in the bar graph below. For semiquantitative analysis of AQP-1 in the dorsal horns, we normalized AQP-1 intensity to the area of the dorsal horn taken for each measurement in each of five sections per rat. Not only did the average intensity of the AQP-1 signals markedly decrease in melatonin-treated rats (bar graph), but melatonin also reduced the depth of AQP-1 labeling in the dorsal horns of SCI rats (see white line in the images above). The images used for the analysis were taken in segment T9 from three rats per group, 35 days after SCI.
Fig. 5
Fig. 5
Co-localization of AQP-1 and GAP-43 in uninjured (a) and injured spinal cords (b). We analyzed GAP-43 and AQP-1 immunolabeling in T9 sections of sham and SCI spinal cords, 1 and 5 months after sham treatment or SCI (n = 3 per group). We used a GAP-43 antibody that recognizes both non-phosphorylated and phosphorylated (activated) GAP-43. As with AQP-1, GAP-43 was most abundant in the superficial laminae of the dorsal horn. Analogous to AQP-1, GAP-43 was increased after SCI throughout the spinal cords, including the GAP-43 labeling in the dorsal horns of SCI rats. AQP-1 and GAP-43 co-localized within the same afferent sensory fibers, as presented in the high-magnification image of the spinal region labeled with the white square. (c) SCI-induced increases in GAP-43 were confirmed with GAP-43 western blots 14 or 42 days after sham-treatment or SCI in T10 segments. We analyzed three sham and three SCI samples.

Similar articles

Cited by

References

    1. Allegra M, Reiter RJ, Tan DX, Gentile C, Tesoriere L, Livrea MA. The chemistry of melatonin's interaction with reactive species. J. Pineal Res. 2003;34:1–10. - PubMed
    1. Amiry-Moghaddam M, Lindland H, Zelenin S, Roberg BA, Gundersen BB, Petersen P, Rinvik E, Torgner IA, Ottersen OP. Brain mitochondria contain aquaporin water channels: evidence for the expression of a short AQP9 isoform in the inner mitochondrial membrane. FASEB J. 2005;19:1459–1467. - PubMed
    1. Basaldella L, Orvieto E, Dei Tos AP, Della Barbera M, Valente M, Longatti P. Causes of arachnoid cyst development and expansion. Neurosurg. Focus. 2007;22:00. - PubMed
    1. Basso DM, Beattie MS, Bresnahan JC. A sensitive and reliable locomotor rating scale for open field testing in rats. J. Neurotrauma. 1995;12:1–21. - PubMed
    1. Boassa D, Stamer WD, Yool AJ. Ion channel function of aquaporin-1 natively expressed in choroid plexus. J. Neurosci. 2006;26:7811–7819. - PMC - PubMed

Publication types

MeSH terms