An event-related fMRI investigation of voice-onset time discrimination
- PMID: 18248740
- PMCID: PMC2265783
- DOI: 10.1016/j.neuroimage.2007.10.064
An event-related fMRI investigation of voice-onset time discrimination
Abstract
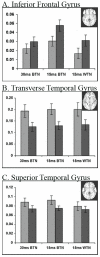
The discrimination of voice-onset time, an acoustic-phonetic cue to voicing in stop consonants, was investigated to explore the neural systems underlying the perception of a rapid temporal speech parameter. Pairs of synthetic stimuli taken from a [da] to [ta] continuum varying in voice-onset time (VOT) were presented for discrimination judgments. Participants exhibited categorical perception, discriminating 15-ms and 30-ms between-category comparisons and failing to discriminate 15-ms within-category comparisons. Contrastive analysis with a tone discrimination task demonstrated left superior temporal gyrus activation in all three VOT conditions with recruitment of additional regions, particularly the right inferior frontal gyrus and middle frontal gyrus for the 15-ms between-category stimuli. Hemispheric differences using anatomically defined regions of interest showed two distinct patterns with anterior regions showing more activation in the right hemisphere relative to the left hemisphere and temporal regions demonstrating greater activation in the left hemisphere relative to the right hemisphere. Activation in the temporal regions appears to reflect initial acoustic-perceptual analysis of VOT. Greater activation in the right hemisphere anterior regions may reflect increased processing demands, suggesting involvement of the right hemisphere when the acoustic distance between the stimuli are reduced and when the discrimination judgment becomes more difficult.
Figures


References
-
- Belin P, Zatorre RJ, Hoge R, Evans AC, Pike B. Event-related fMRI of the auditory cortex. Neuroimage. 1999;10:417–429. - PubMed
-
- Binder JR, Price C. Functional neuroimaging of language. In: Cabeza R, Kingstone A, editors. Handbook of Functional Neuroimaging of Cognition. MIT press; Cambridge: 2001. pp. 187–251.
-
- Binder JR, Liebenthal E, Possing ET, Medler DA, Ward BD. Neural correlates of sensory and decision processes in auditory object identification. Nature Neuroscience. 2004;7:295–301. - PubMed
-
- Blumstein SE. Deficits of speech production and speech perception in aphasia. In: Berndt R, editor. Handbook of Neuropsychology. 2nd edition Vol. 2. Elsevier Science; the Netherlands: 2000. pp. 95–113.
-
- Blumstein SE, Myers EB, Rissman J. The perception of voice-onset time: An fMRI investigation of phonetic category structure. Journal of Cognitive Neuroscience. 2005;17:1353–1366. - PubMed
Publication types
MeSH terms
Grants and funding
LinkOut - more resources
Full Text Sources
Medical

