. 2008 Mar 1;7(3):392-404.
doi: 10.1016/j.dnarep.2007.11.013. Epub 2008 Jan 11.

Cooperative damage recognition by UvrA and UvrB: identification of UvrA residues that mediate DNA binding

Affiliations

Cooperative damage recognition by UvrA and UvrB: identification of UvrA residues that mediate DNA binding

Deborah L Croteau et al. DNA Repair (Amst). .

Abstract

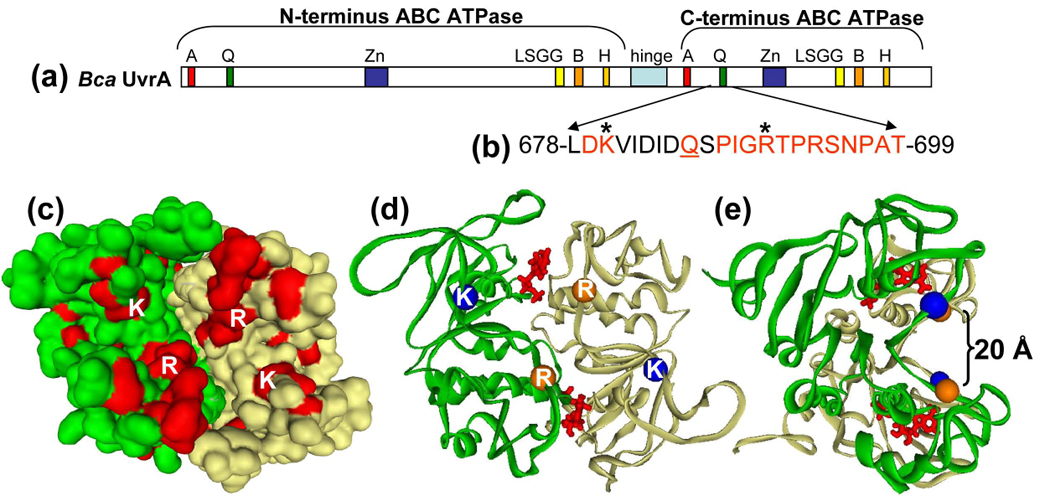
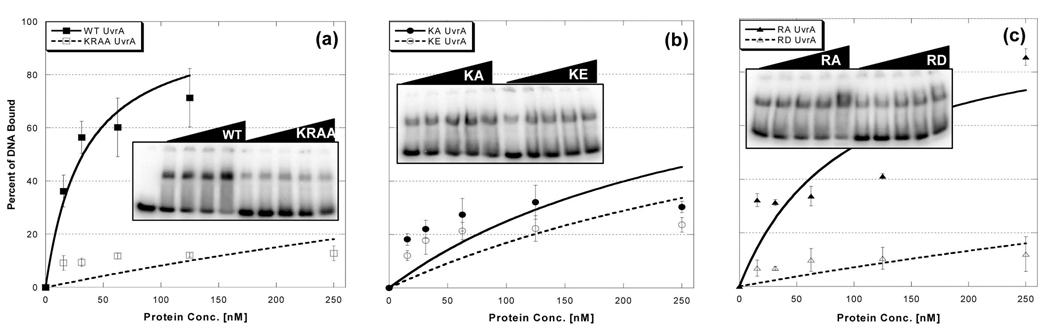
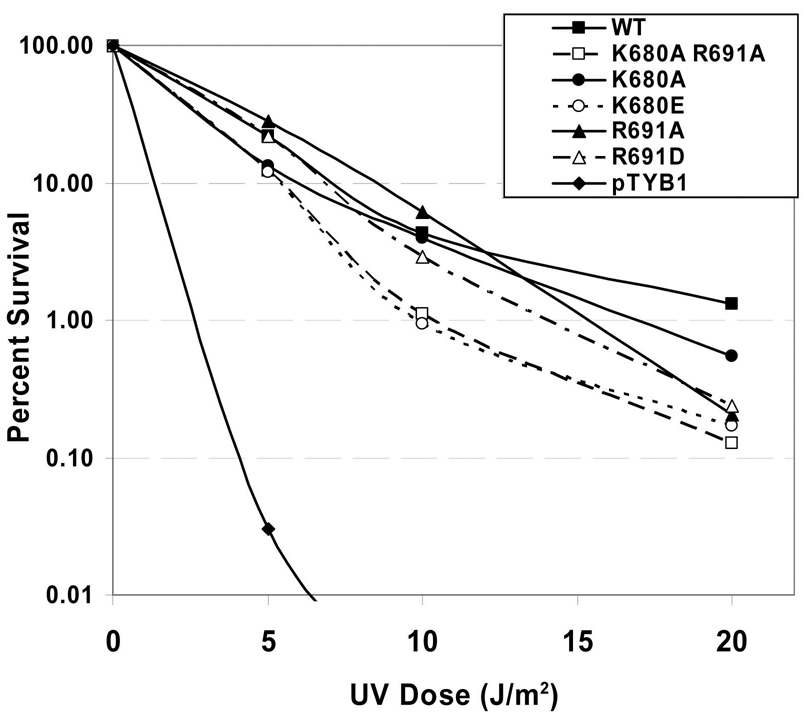
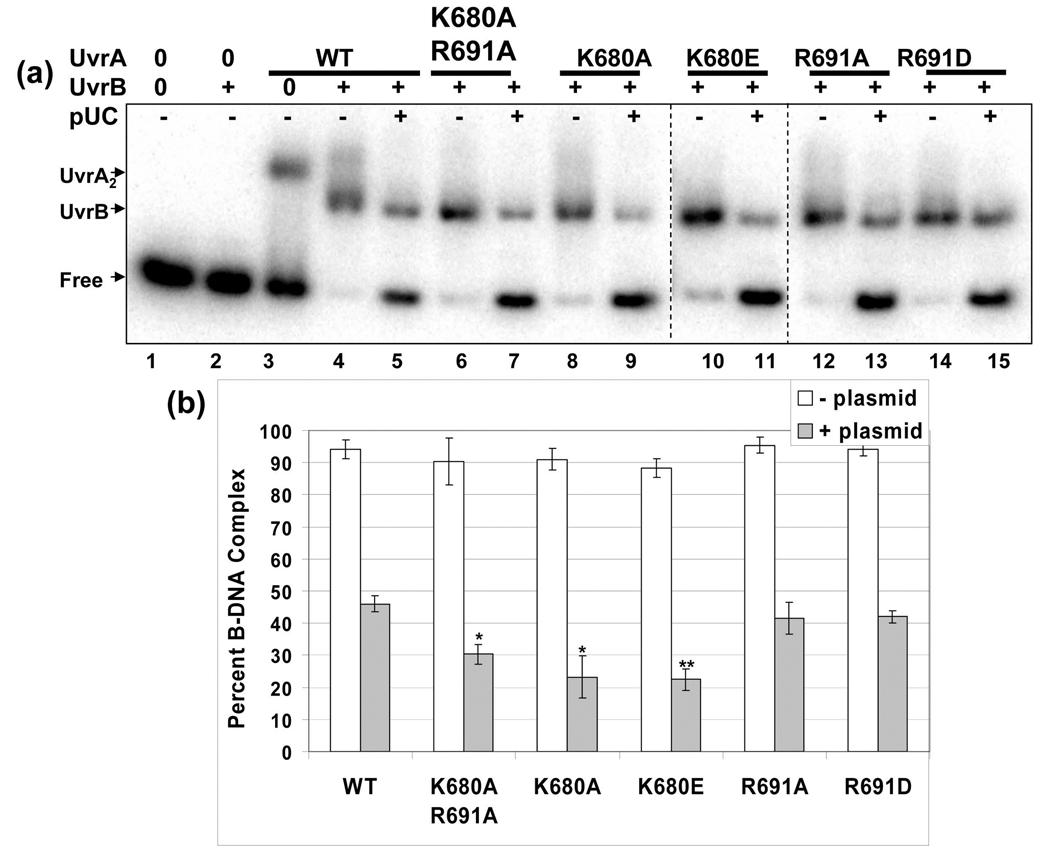
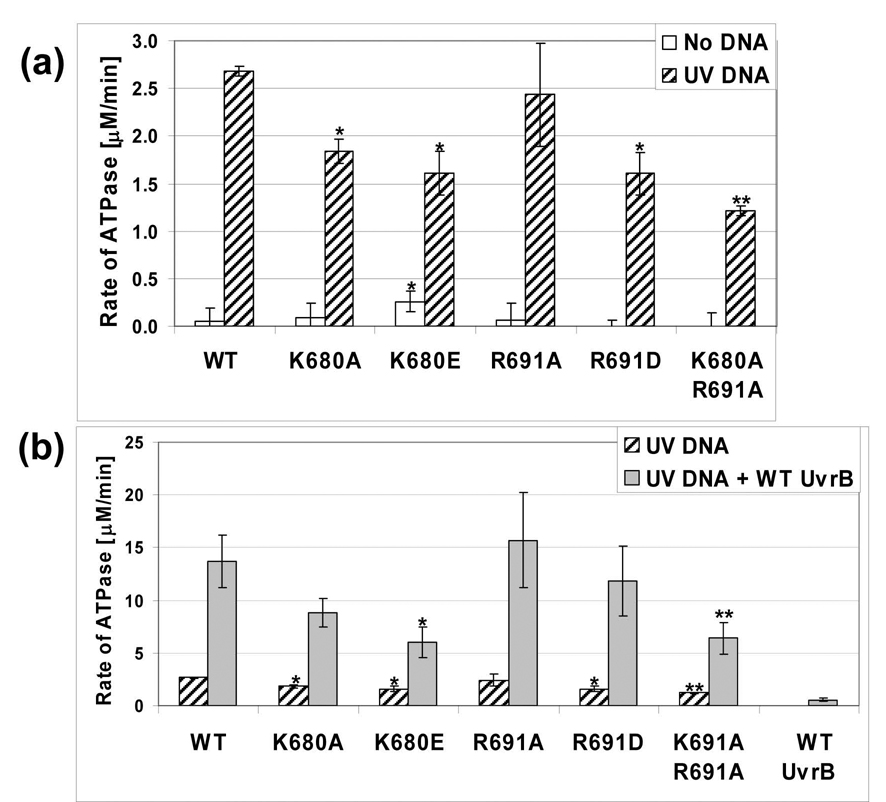
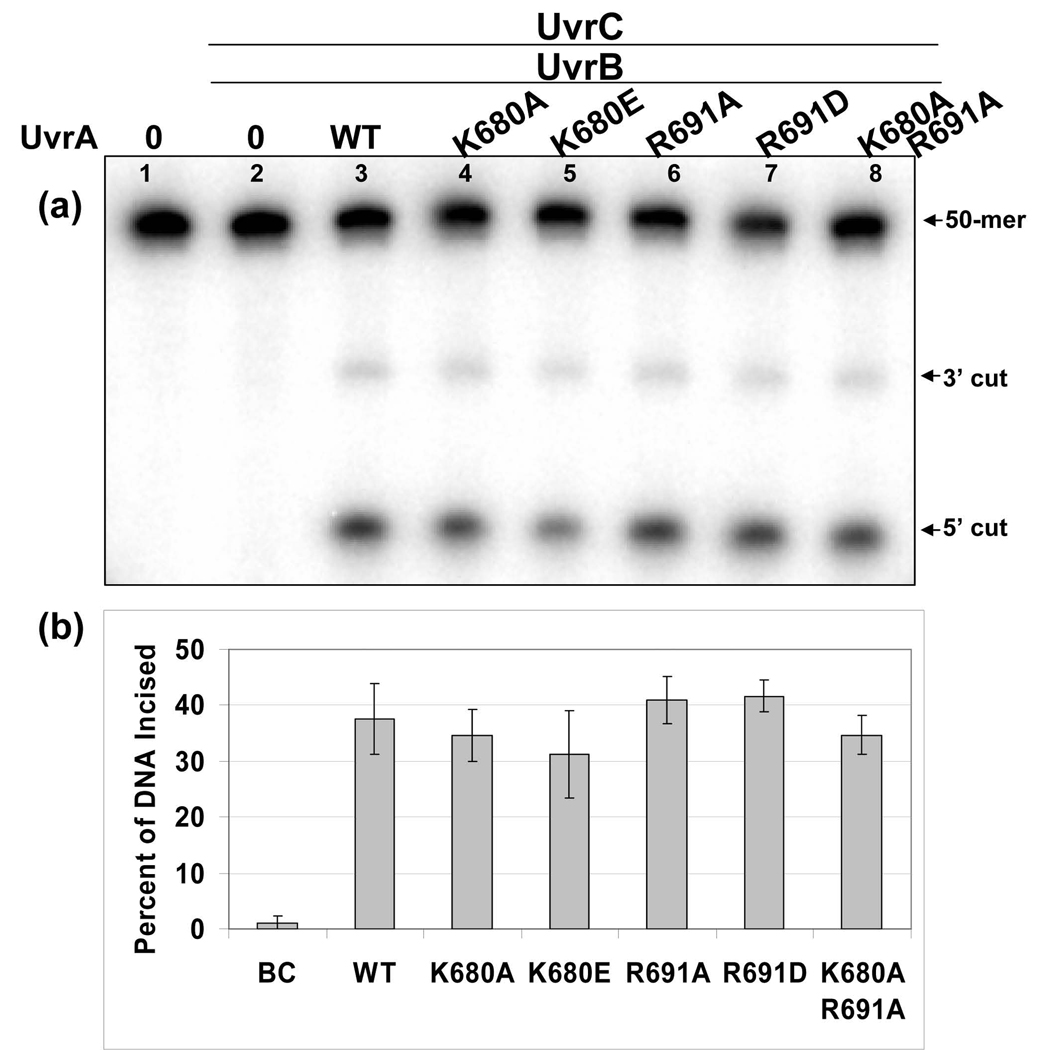
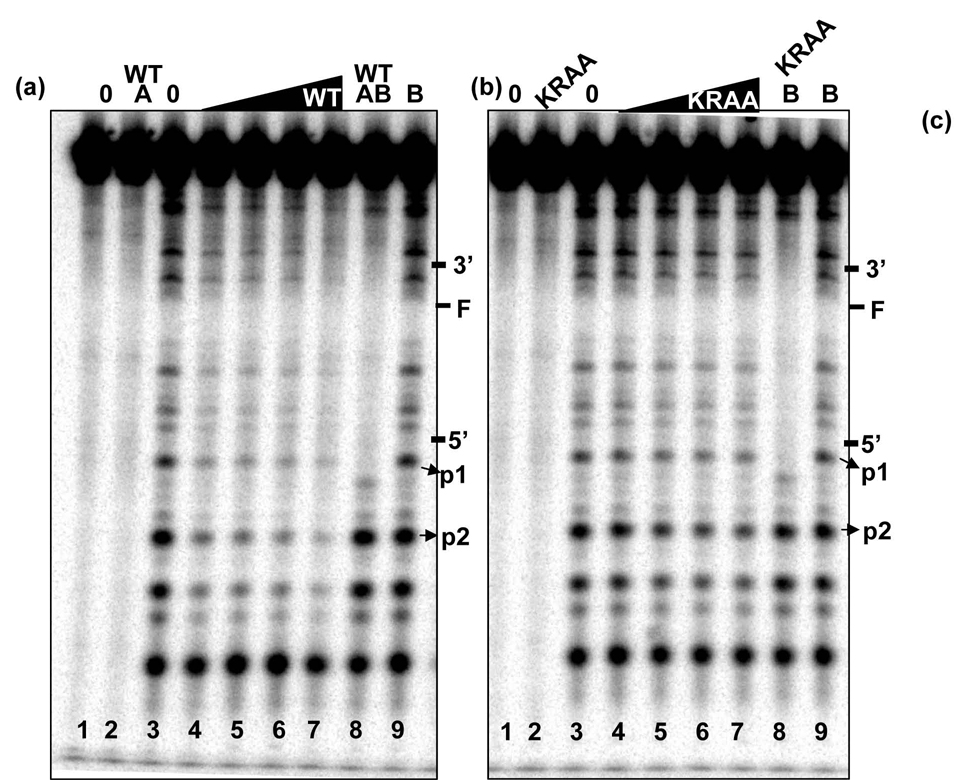
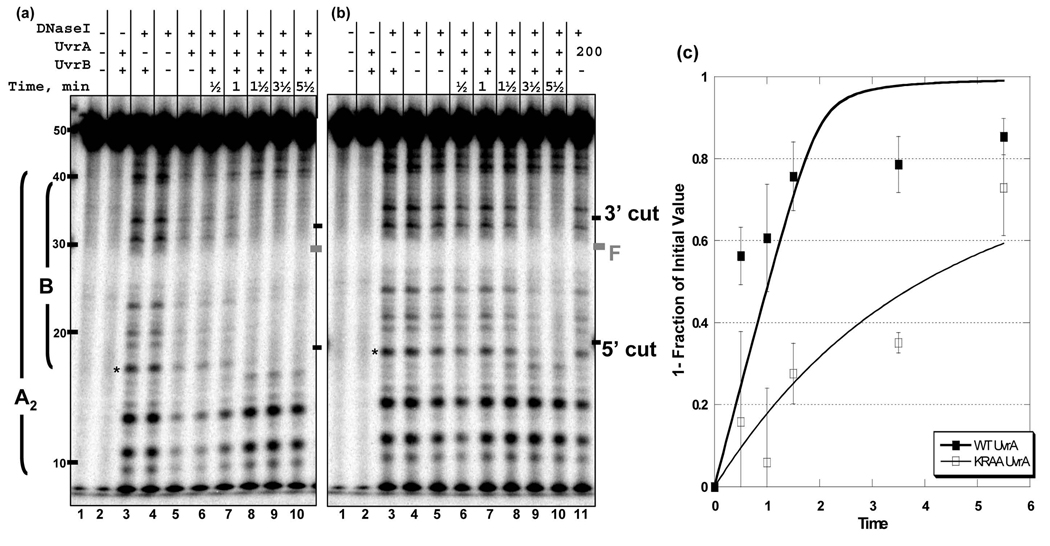
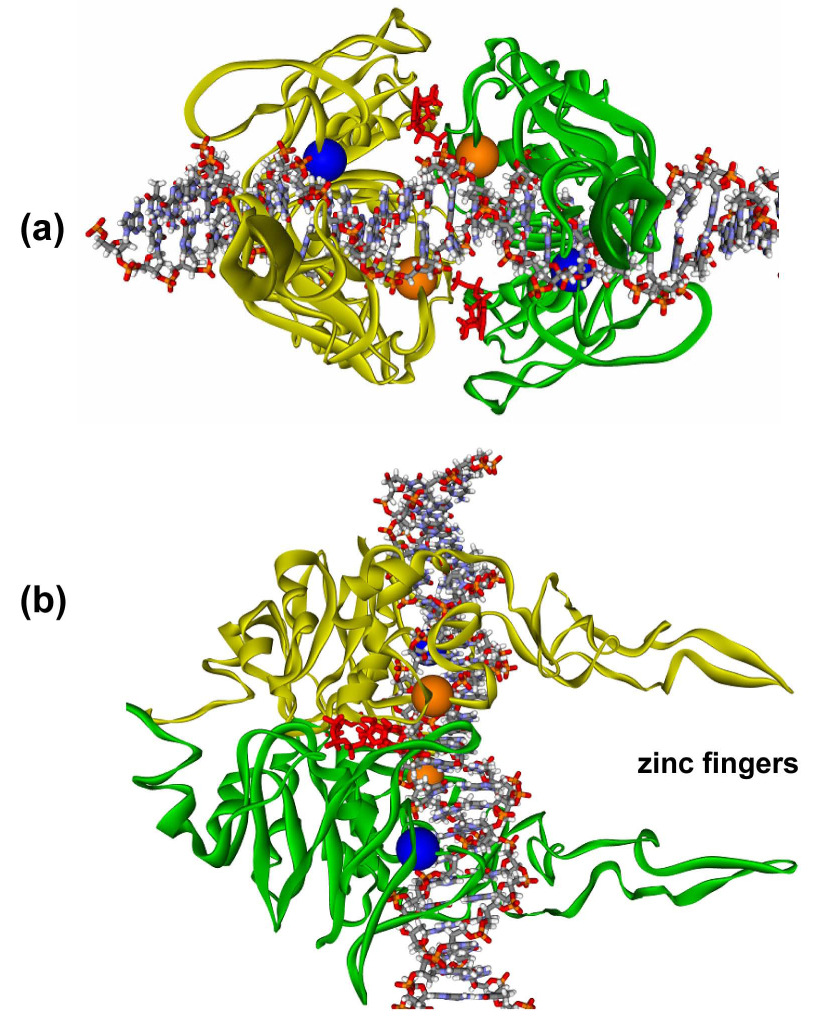
Nucleotide excision repair (NER) is responsible for the recognition and removal of numerous structurally unrelated DNA lesions. In prokaryotes, the proteins UvrA, UvrB and UvrC orchestrate the recognition and excision of aberrant lesions from DNA. Despite the progress we have made in understanding the NER pathway, it remains unclear how the UvrA dimer interacts with DNA to facilitate DNA damage recognition. The purpose of this study was to define amino acid residues in UvrA that provide binding energy to DNA. Based on conservation among approximately 300 UvrA sequences and 3D-modeling, two positively charged residues, Lys680 and Arg691, were predicted to be important for DNA binding. Mutagenesis and biochemical analysis of Bacillus caldontenax UvrA variant proteins containing site directed mutations at these residues demonstrate that Lys680 and Arg691 make a significant contribution toward the DNA binding affinity of UvrA. Replacing these side chains with alanine or negatively charged residues decreased UvrA binding 3-37-fold. Survival studies indicated that these mutant proteins complemented a WP2 uvrA(-) strain of bacteria 10-100% of WT UvrA levels. Further analysis by DNase I footprinting of the double UvrA mutant revealed that the UvrA DNA binding defects caused a slower rate of transfer of DNA to UvrB. Consequently, the mutants initiated the oligonucleotide incision assay nearly as well as WT UvrA thus explaining the observed mild phenotype in the survival assay. Based on our findings we propose a model of how UvrA binds to DNA.


Figures

Fig. 1
Fig. 1. Region of UvrA under investigation
Panel a, Linear sequence of Bca UvrA. The important features of UvrA are denoted by the boxed areas: Walker A, A; Q-loop, Q; zinc finger, Zn; signature sequence, LSGG; Walker B, B; Histidine-loop, H and hinge region. Panel b, The highly conserved sequence under investigation is shown by the red amino acids. The Q-loop glutamine is underlined and the asterisks denote amino acids Lys680 and Arg691. Panel c, An alignment of 30 UvrA sequences was constructed and the conserved amino acids, excluding the ABC ATPase motifs, were painted onto the 3D model of UvrA's C-terminal dimer. Lys680 (K) and Arg691 (R) are depicted on the surface. This model lacks the zinc finger domain. Panel d, Ribbon diagram showing the α carbons of Lys680 (blue spheres) and Arg691 (orange spheres). ATP is shown in red at the dimer interface. Panel e, Rotation of the model in panel c to show that Lys680 and Arg691 are predicted to lie on the walls of a concave cleft on the surface of the UvrA dimer.
Fig. 2
Fig. 2. Damaged DNA binding profiles of UvrA in the presence of ATP and magnesium
EMSA was used to monitor the DNA binding properties of the proteins. Increasing amounts of the indicated UvrA protein were incubated with 2 nM F2650/NDB duplex DNA in reaction buffer containing ATP (1 mM) and MgCl2 (10 mM) for 15 min at 37 °C, see Experimental Procedures for additional details. The reactions were separated on 3.5% polyacrylaminde native gels in the presence of ATP (1 mM) and MgCl2 (10 mM). Panels a–c, Quantitative analysis of EMSA gels with representative gels as inserts. The data are reported as the mean ± S.D., n=3. Binding isotherms were fitted by nonlinear regression analysis using Kaleidagraph and the method of Schofield [26].
Fig. 3
Fig. 3. UV survival of E. coli WP2 uvrA strain transformed with UvrA variants
WP2 (trp, uvrA) cells were transformed with pT7pol26, a plasmid encoding an IPTG-inducible T7 polymerase and pTYB1 or pTYB1-uvrA vector. After individual colonies were selected and grown to an A600 of ~1, the cell cultures were diluted 2-fold, and the proteins were induced with IPTG (0.1 mM) for 1h at 37 °C. Serial dilutions of each sample of culture (100 µl) were spread onto a nutrient rich-media and UV-irradiated with a 254 nM germicidal light source. The numbers of colonies visible after 20 h of growth at 37 °C were recorded and the fraction of cells surviving after each dose of UV was calculated based on the plating efficiency of the nonirradiated controls. The mean of two or three independent experiments is reported. Transformants contained pT7pol26 and pTYB1 (diamonds), pTYB1-WT uvrA (solid squares), pTYB1-K680A/R691A uvrA (open squares), pTYB1-K680A uvrA (solid circle), pTYB1-K680E uvrA (open circle), pTYB1-R691A uvrA (solid triangles) or pTYB1-R691D uvrA (open triangles).
Fig. 4
Fig. 4. Lys680 mutants transfer less UvrB onto the damaged oligonucleotide than the other UvrA variants
Panel a, The ability of the individual UvrA proteins to load WT UvrB onto the radiolabeled fluorescein adducted oligonucleotide was monitored by EMSA. The UvrA proteins (20 nM) were incubated with UvrB (100 nM) with or without competitor DNA (pUC19) for 15 min at 55 °C. The protein-DNA complexes were separated on 3.5% native polyacrylamide gels containing ATP (1 mM) and MgCl2 (10 mM). Dashed lines indicate merged gels run at the same time. pUC is the plasmid, pUC19. Panel b. Analysis of the EMSAs reporting the percentage of DNA in the B·DNA complex. White and filled bars represent B·DNA complexes produced in the absence and presence of competitor DNA, respectively. The data are reported as the mean ± S.D., n=3. Paired Student's T-tests were performed between WT and the variants and (*) indicates that the probability was less than 0.05 while (**) reflects a probability less than 0.01.
Fig. 5
Fig. 5. ATPase activity of the UvrA variants
Panel a, The conversion of ATP to ADP by the UvrA proteins (50 nM) in the presence or absence of UV irradiated DNA (1 µg) was monitored using a coupled enzyme assay system consisting of pyruvate kinase and lactate dehydrogenase, which links the hydrolysis of ATP to the oxidation of NADH (see Experimental Procedures). White bars indicate activity in the absence of DNA while hatched bars designate the presence of UV irradiated DNA. Panel b, UvrA·UvrB ATPase activity. Hatched bars indicate the level of ATPase activity of the UvrA proteins (50 nM) with UV DNA while the filled bars represent the activity of UvrA (50 nM) and UvrB (100 nM) in the presence of UV DNA. The data are reported as the mean ± S.D, n=3. Paired Student's T-tests were performed between WT and the variants and (*) indicates that the probability was less than 0.05 while (**) reflects a probability less than 0.01.
Fig. 6
Fig. 6. All UvrA variants are capable of initiating the NER reaction
Panel a, Incision of a 5′ end-labeled substrate (F2650/NDB) was monitored by denaturing polyacrylamide gel electrophoresis. The fluorescein adducted 50-bp duplex (F2650/NDB, 2 nM) was incubated with UvrB (100 nM), UvrC (50 nM) and the indicated UvrA protein (20 nM), for 5 min at 55 °C in reaction buffer. The reactions were terminated by the addition of EDTA (20 mM) and the incision products were analyzed on a 10% denaturing polyacrylamide gel. Panel b, Graphic representation of the extent of incision for the reactions containing the various UvrA proteins. Data are reported as the mean ± S.D., n=3.
Fig. 7
Fig. 7. DNase I Footprinting
DNase I footprint of the WT and KRAA UvrA proteins bound to the 50 bp F2650/NBD duplex with the 32P on the 5′ end of the damaged strand. The indicated proteins were incubated with 2 nM duplex in the presence of 50 mM Tris-HCl, pH 7.5, 50 mM KCl, 10 MgCl2, 1 mM ATP, 10 mM DTT, 100 nM bovine serum albumin for 15 min at 37 °C then DNase I treated and processed as described in the methods. Panel a, WT UvrA DNase I footprint. Panel b, KRAA UvrA DNase I footprint. Both gels are loaded in the same order. The lanes contained the following: lane 1, no protein and no DNase I; lane 2, UvrA2, 10 nM and no DNase I; lane 3, no protein plus DNase I; lanes 4–7, increasing concentrations of UvrA2, 10 – 80 nM, plus DNase I; lane 8, UvrA2, 10 nM, WT UvrB, 100 nM, plus DNase I; lane 9, WT UvrB, 100 nM, plus DNase I. The position of the adduct and the 3′ and 5′ incision sites are noted on the left-hand side of the gels. The bands that were quantified for the graph in panel c are denoted by the arrows, p1 and p2. Panel c, graphic representation of the band intensities of p1 and p2 relative to the band intensity observed in lane 3, DNase I digestion in the absence of proteins. The average of 3 independent experiments was plotted with the standard deviation at each point. Binding isotherms were fitted by nonlinear regression analysis using Kaleidagraph and the method of Schofield [26]. For more details see the Materials and Methods.
Fig. 8
Fig. 8. Rate of transfer of DNA from UvrA to UvrB
DNase I footprinting of Bca UvrA and Bca UvrB-DNA complexes. Reaction mixtures contained UvrA2 (10 nM), ± 100 nM UvrB, 2 nM F2650/NDB duplex with the radiolabel on the damaged strand. The reactions were incubated at 37 °C then DNase I was added for 30 sec at RT. Then the samples were processed as described in the methods. The time indicated in the figure includes the time for DNase I digestion. Panel a, Gel image showing the transition of the WT UvrA footprint to WT UvrB footprint. The right side of the gel contains a graphic representation of the DNase I footprints observed. Panel b, Gel image showing the transition of the KRAA UvrA footprint to the WT UvrB footprint. The position of the adduct and the 3′ and 5′ incision sites are noted on the left-hand side of the gels. Asterisks indicate the position of the band used to quantify the gels, p1. Panel c, Graphic representation of the band intensities of p1 relative to the band intensity observed in lane 4, DNase I digestion in the absence of proteins. The average of 3 independent experiments was plotted with the standard deviation at each point. Data were fit to a single or double exponential using Excel.
Fig. 9
Fig. 9. Proposed structural model of the C-terminus ABC ATPase dimer of Bca UvrA with DNA
The model was constructed as described in the Experimental Procedures section. The model predicts that the DNA lies across the C-terminus ABC ATPase dimer of UvrA such that the DNA interacts with Lys680 and Arg691. In this model, approximately 17 base pairs of DNA would be in contact with the dimer. The zinc finger projections extend away from the DNA binding cleft. Panel a, View of the C-terminus UvrA dimer looking down the axis of the zinc fingers. Panel b, Side view showing the DNA laying across the dimer interface and the zinc fingers projecting out to the right. The two ATP molecules are depicted in red at the dimer interface. The α carbons of Lys680 (blue spheres) and Arg691 (orange spheres) are shown in CPK style.

References

    1. Croteau DL, Dellavecchia MJ, Skorvaga M, Van Houten B. Damage recognition by the bacterial nucleotide excision repair machinery. In: Wolfram S, Kow YW, Doetsch PW, editors. DNA Damage Recognition. Boca Raton, FL: Taylor & Francis; 2005. pp. 111–138.
    1. Van Houten B, Croteau DL, DellaVecchia MJ, Wang H, Kisker C. 'Close-fitting sleeves': DNA damage recognition by the UvrABC nuclease system. Mutat Res. 2005;577:92–117. - PubMed
    1. Truglio JJ, Croteau DL, Van Houten B, Kisker C. Prokaryotic Nucleotide Excision Repair: The UvrABC System. Chem Rev. 2006;106:233–252. - PubMed
    1. Moolenaar GF, Schut M, Goosen N. Binding of the UvrB dimer to non-damaged and damaged DNA: residues Y92 and Y93 influence the stability of both subunits. DNA Repair (Amst) 2005;4:699–713. - PubMed
    1. Orren DK, Sancar A. Formation and enzymatic properties of the UvrB.DNA complex. J Biol Chem. 1990;265:15796–15803. - PubMed

Publication types

MeSH terms

LinkOut - more resources